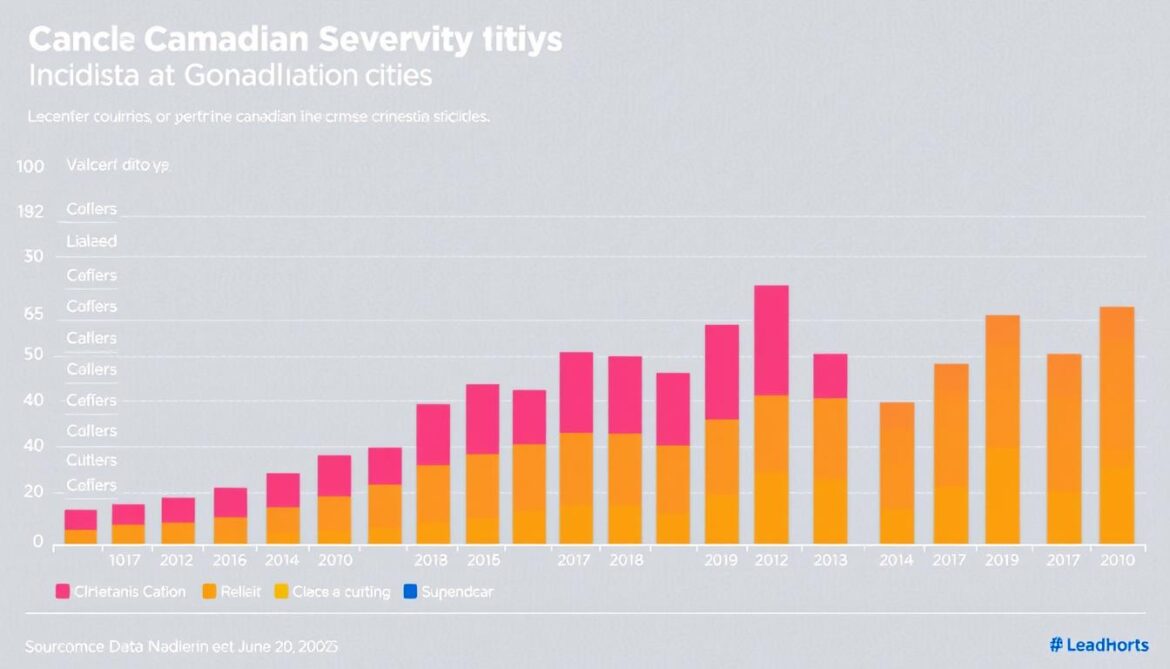
Did you know Winnipeg’s Crime Severity Index sits at 135.8 – nearly double Toronto’s 69.2? This striking gap reveals how safety landscapes shift dramatically across urban centres. Canadian communities face unique challenges, with Edmonton (113.3) and Vancouver (90.2) showing distinct patterns in recent reports.
You’ll find these numbers aren’t random. They reflect complex factors like economic conditions and population density. Standardized metrics like the Crime Severity Index help measure trends objectively, offering apples-to-apples comparisons between municipalities.
Why does this matter? Understanding regional differences helps identify what drives unlawful behavior. Coastal hubs might grapple with property offenses, while prairie cities face higher violent activity rates. Local initiatives and policing strategies also shape these outcomes.
Statistics Canada collaborates with law enforcement to ensure reliable reporting. Their methods account for population size and incident types, creating a clear picture of risks. When reviewing these figures, always check the timeframe and collection processes behind them.
Spotting patterns in urban safety data empowers smarter decisions – whether you’re relocating or shaping community programs. The next sections break down what these metrics mean and how to interpret them effectively.
Overview of Canada Crime Data
Recent shifts in urban safety metrics reveal Toronto’s CSI climbed 10.8% last year, while Vancouver saw a 2.4% drop. These variations highlight how regional dynamics shape community safety. Montréal’s modest 2.2% CSI increase further demonstrates that no two cities share identical patterns.

Recent Trends and Statistical Insights
You’ll notice three distinct stories in 2023 data. The Greater Toronto Area reached 58.5 CSI – its highest mark in five years. Metro Vancouver dipped to 90.2 CSI despite higher population density. Montréal’s 63.2 CSI shows stability compared to western hubs.
What drives these changes? Economic pressures and shifting demographics play starring roles. Coastal cities often report more property-related incidents, while prairie regions face acute violent activity spikes. Police staffing levels and public trust in law enforcement also sway the numbers.
Key Factors Influencing Crime Rates
Four elements consistently impact safety metrics:
- Employment opportunities in vulnerable neighborhoods
- Accessibility of mental health support systems
- Community-led prevention initiatives
- Drug policy enforcement approaches
Statistics Canada’s nationwide data collection ensures apples-to-apples comparisons. Their methods account for population shifts and reporting consistency. Remember – these figures reflect both incidents and public willingness to engage authorities.
A Guide to Compare Crime Statistics by City
The key to meaningful urban safety comparisons lies in methodological precision. Standardized tools account for population differences and offense severity, transforming raw numbers into actionable insights. You’ll find municipalities like Edmonton and Toronto show vastly different safety profiles when analyzed through this lens.

Methodologies for Effective Comparison
Effective analysis starts with consistent reporting frameworks. Authorities use identical data collection windows and adjust for factors like economic disparities. For example, presenting incidents per 100,000 residents lets you evaluate Calgary’s 72.5 CSI against Montréal’s 80.0 fairly.
Three principles govern reliable comparisons:
- Weighting violent acts more heavily than property offenses
- Using court sentencing data to determine severity scales
- Excluding seasonal fluctuations through multi-year averaging
Understanding the Crime Severity Index
The crime severity index measures both frequency and societal impact. A shoplifting incident contributes less to the score than an assault. This explains why Edmonton’s 113.3 CSI towers over Toronto’s 69.2 – their offense types differ radically.
You’ll notice the index reflects actual judicial outcomes rather than theoretical penalties. This approach ensures weights align with community values. When you explore Canada’s crime rates, remember higher indexes don’t always mean more incidents – they indicate more serious offenses.
Crime Data Across Major Canadian Cities
Urban safety landscapes in Canada’s largest municipalities reveal contrasting realities. While Toronto’s crime severity index jumped 11.3% to 69.2 last year, Montréal saw a modest 0.9% rise to 80.0. Vancouver’s 5.6% increase pushed its index to 97.0 – the highest among major canadian cities.

Analysis of Trends in Toronto, Montréal, and Vancouver
Toronto’s growth stems from rising property crime in densely populated neighborhoods. Montréal maintains lower violent crime rates than western counterparts despite similar population pressures. Vancouver’s challenges center on theft-related incidents that disproportionately affect its index.
Smaller urban centers tell different stories. Thunder Bay recorded a CSI of 103.0 despite having 90% fewer residents than Toronto. Its violent crime rates rival those of cities triple its size. Conversely, waterloo region reduced its index by 4.4% through targeted community programs.
These patterns prove population size doesn’t dictate safety outcomes. Coastal hubs face distinct pressures compared to prairie communities. Understanding these variations helps tailor prevention strategies to local needs.
Data Sources and Reliability for Crime Statistics
How do we know crime statistics reflect reality? Trustworthy analysis starts with understanding where the numbers come from. Canada’s safety metrics blend federal oversight with local enforcement details, creating a mosaic of verified information.
Integrating Statistics Canada and Police Data
Statistics Canada works with police services nationwide to standardize reports. Systems like Vancouver’s PRIME track incidents but require months for quality checks. This explains why official crime rates often lag two to three months behind real events.
You’ll find three layers of validation in police-reported crime data:
- Initial incident classification by officers
- Review for accuracy during investigations
- Federal aggregation with population adjustments
Evaluating Data Collection Methods and Updates
Reliability hinges on more than just numbers. Community reporting habits and police resources shape what gets recorded. For example, some assaults might go unreported, while minor thefts could appear inflated due to repeat filings.
Consider these factors when reviewing trends:
- Updates to offense classifications over time
- Variations in regional reporting protocols
- The seriousness weighting applied to different acts
When exploring violent crime trends, remember these figures represent processed cases – not instant snapshots. This deliberate approach ensures accuracy but requires patience when tracking emerging patterns.
Comparing Canada Crime Trends with the United States
North American safety patterns diverge sharply when crossing the 49th parallel. While Canada uses its Crime Severity Index, the United States relies on FBI Uniform Crime Reporting metrics. These distinct approaches shape how each nation tracks unlawful activities.

Overview of FBI Crime Rate Data in the U.S.
American law enforcement aggregates incidents per 100,000 residents. This creates stark contrasts – Irvine, California reports 61.21 violent acts per capita, while St. Louis hits 2,082.29. Such extremes rarely appear in Canadian urban centers.
You’ll notice U.S. crime rates focus on specific categories like robbery and murder. This differs from Canada’s emphasis on offense severity. Anchorage’s 6,640 total incidents per 100k people would translate differently under CSI weighting.
Key Differences in Reporting and Measurement
Three factors complicate direct comparisons:
- Canada weights offenses by judicial sentencing outcomes
- U.S. data prioritizes raw incident counts
- Property offenses dominate American reports differently
Community safety strategies also vary. Canadian cities often blend social services with policing, whereas U.S. approaches lean heavier on enforcement. These philosophies influence both prevention outcomes and statistical trends.
When analyzing violent crimes, remember Canadian data reflects severity-adjusted impacts. A single assault in Edmonton affects the CSI more than multiple shoplifting cases in Mobile. This explains why cross-border ranking comparisons often mislead without context.
Understanding Violent Crime and Property Crime Statistics
Canadian communities experience safety challenges differently based on offense types. Halton Region’s CSI of 31.4 contrasts sharply with Prince Albert’s 334.0 – a tenfold difference showing how geography shapes risk profiles.

What Constitutes Violent Offenses?
Violent acts like assaults and robberies carry heavier weight in safety metrics. These incidents account for less than 20% of total reports but drive 60-75% of CSI scores in high-index areas. Sexual offenses and homicides further amplify severity calculations despite lower frequency.
Breaking Down Property-Related Incidents
Theft and fraud dominate urban reports, making up 80% of unlawful acts in some regions. However, their impact on severity indexes remains modest. A shoplifting spree affects scores less than one aggravated assault, even with multiple occurrences.
| Region | CSI Score | Top Violent Offense | Common Property Offense |
|---|---|---|---|
| Halton | 31.4 | Assault (58%) | Theft under $5,000 |
| Prince Albert | 334.0 | Robbery (41%) | Break-and-enter |
Economic stability often links to lower rates of both offense categories. Regions with robust social programs typically see 30-50% fewer incidents than areas facing employment challenges. Seasonal patterns also emerge – vandalism peaks in summer months, while fraud spikes during holidays.
Interactive Tools and Mapping for Crime Analysis
Modern technology transforms how we understand urban safety challenges. Digital mapping systems like Vancouver Police’s GeoDASH turn complex data into actionable insights. These platforms reveal patterns hidden in spreadsheets, helping communities address risks proactively.
Using GeoDASH and Other Visualization Tools
GeoDASH offers three powerful features for analyzing safety trends. The Map tool pinpoints incident locations across Canadian provinces, while Stats breaks down activity types. Researchers access raw data through Open Data portals, using methods that count every violation – not just the most severe.
You’ll find these systems particularly useful for spotting recurring issues in specific neighborhoods. A single glance can show whether thefts cluster near transit hubs or if assaults peak during certain hours. This clarity helps tailor prevention strategies to local realities.
Benefits of Mapping Tools in Community Safety
Interactive maps empower residents and policymakers alike. They highlight areas with lower rates of unlawful activity, guiding property investments and patrol allocations. Historical views spanning multiple years show whether initiatives actually reduce risks over time.
Communities gain three key advantages:
- Visual identification of hotspots needing urgent attention
- Comparison of trends between cities and provinces
- Data-driven decisions for resource distribution
These tools don’t just react to problems – they help prevent them. By understanding spatial patterns, neighborhoods can deploy lighting upgrades or social programs where they’ll make the most impact.
Conclusion
Urban safety patterns reveal critical insights when analyzed through Canada’s severity-weighted framework. Regional differences between provinces show prairie cities often face distinct challenges compared to coastal hubs. These variations stem from economic factors, population dynamics, and local approaches to addressing unlawful acts.
Understanding crime trends helps communities allocate resources where they matter most. Neighborhood initiatives in high-risk areas demonstrate measurable impacts, while provinces with stable indexes often share robust social support systems. The seriousness of offenses plays a pivotal role in shaping these metrics.
You’ll find value in tracking annual updates through verified sources. Whether evaluating relocation options or developing prevention programs, context-aware analysis beats simplistic ranking comparisons. Canada’s evolving safety landscape rewards those who consider both numbers and neighborhood realities.
Data-driven awareness fosters safer cities without compromising community character. As patterns shift, this knowledge empowers proactive responses tailored to regional needs across provinces.

