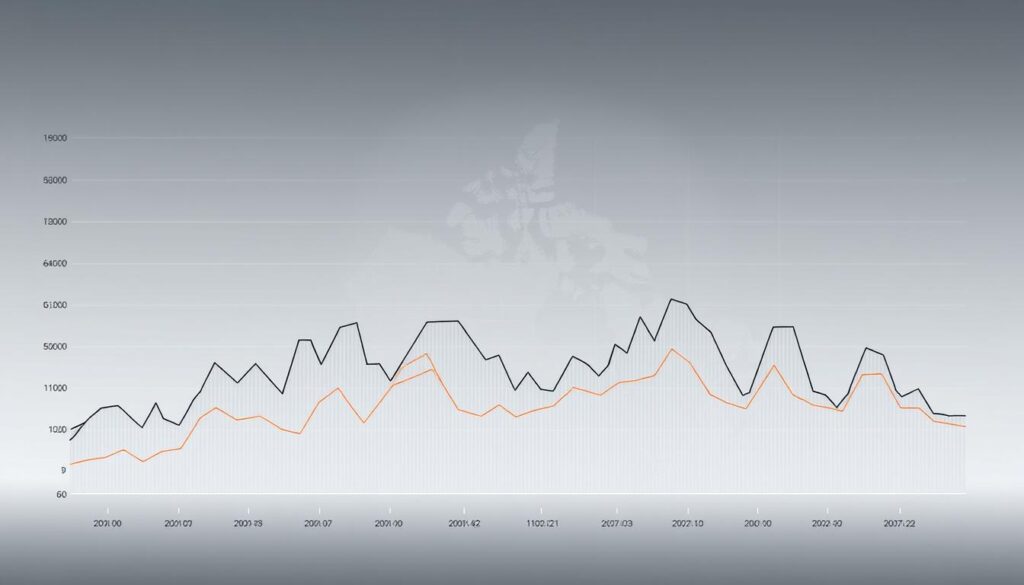
Canada’s national police-reported crime rate reached 5,843 incidents per 100,000 people in 2023. This marks a three-per-cent increase from the previous year, with the Crime Severity Index rising for the third consecutive time. While the country ranks 11th on the Global Peace Index, these numbers reveal a complex reality beneath its reputation for safety.
You might wonder how certain urban centres experience crime rates double the national average while others remain remarkably secure. This article unpacks that paradox, using the latest statistics to explore patterns across municipalities. The Crime Severity Index plays a crucial role here—it weighs both the volume and seriousness of offences, offering a clearer picture than raw crime counts alone.
Understanding these metrics helps explain why specific locations face unique challenges. Property theft, violent incidents, and drug-related offences vary widely between regions. You’ll learn how analysts determine which areas require closer attention and what factors contribute to higher risk levels.
This analysis doesn’t just highlight problems—it equips you with knowledge to make informed decisions about safety. By comparing trends over time and against international benchmarks, you’ll gain perspective on Canada’s evolving urban landscape. Let’s examine how crime distribution defies stereotypes and where communities are implementing effective solutions.
Overview of Canada Crime Rates and Trends
While Canada ranks among the world’s safest countries, recent patterns reveal uneven security landscapes across its regions. The Crime Severity Index (CSI)—a tool measuring both frequency and harm of offences—rose 2% nationally in 2023, continuing a three-year upward trend. This metric helps explain why some communities face heightened risks despite stable violent crime rates elsewhere.

National Safety Metrics and Recent Statistics
Statistics Canada’s data shows fraud surged 46% over the past decade, outpacing other offences like theft and drug-related crimes. Though violent acts per 100,000 people remained steady overall, urban centers reported alarming spikes:
- Break-ins increased 18% in western metro areas
- Vehicle thefts jumped 24% year-over-year in Ontario
- Sexual assault reports rose 9% nationally since 2020
These shifts highlight how crime rates don’t tell the whole story—the CSI’s severity weighting exposes concentrated pressures in specific locales.
Impact on Local Communities and Perceptions
Neighborhoods with rising crime severity often experience cascading effects. Business owners face higher insurance costs, while residents report altered routines due to safety concerns. A 2023 Angus Reid survey found 61% of Canadians in affected areas limit nighttime activities—despite actual victimization rates being far lower.
Media coverage amplifies this disconnect. Cities with modest crime rate increases sometimes dominate headlines, skewing public perception. Yet data-driven policing strategies in Halifax and Winnipeg have successfully reduced break-ins by 14% through targeted patrols and community outreach.
Key Factors Influencing City Crime in Canada
Understanding why certain urban areas experience heightened criminal activity requires examining underlying social and economic pressures. These elements interact uniquely in different regions, creating distinct challenges for residents and authorities alike.

Socioeconomic Conditions and Urban Growth
Income gaps and housing shortages create fertile ground for criminal behaviour. Cities like Vancouver and Toronto see higher property crime rates in neighbourhoods where average rents consume 60% of household income. When urban populations grow faster than social services, schools and community programs struggle to keep pace.
Resource-dependent regions face unique pressures. Boom-bust cycles in Alberta’s oil towns correlate with spikes in theft and assault cases. A 2022 study noted: “Economic instability directly impacts crime patterns, particularly in single-industry communities.”
Drug Networks and Policing Complexities
Major ports in British Columbia serve as gateways for international drug trafficking routes. Gang activity flourishes near transportation hubs, with law enforcement agencies reporting 23% more drug seizures in western regions since 2021. Competing jurisdictions and limited resources often hamper coordinated responses.
Police staffing levels per capita vary widely across provinces. While Montreal invests in community outreach programs, some prairie cities face officer shortages that delay emergency response times. These disparities highlight how local factors shape safety outcomes more than national trends.
Data-Driven Insights into Urban Crime Patterns
Crime analysis in Canadian cities reveals patterns that challenge simple assumptions about public safety. Traditional crime counts often miss critical context about offence severity and community impact. This is where advanced metrics like the Crime Severity Index transform how we interpret urban security challenges.
Understanding the Crime Severity and Safety Index
The Crime Severity Index assigns weight to offences based on their harm potential. A robbery affects CSI calculations more significantly than a bicycle theft, for example. Statistics Canada uses this method to provide 58% more accuracy in safety assessments compared to basic incident counts.

| Region | Key Crime Issues | CSI Change (2022-2023) |
|---|---|---|
| Interior B.C. | Property theft fluctuations | +14% |
| Prairie Cities | Gang-related assaults | +9% |
| Ontario Suburbs | Vehicle thefts | +22% |
Year-over-Year Trends and Regional Fluctuations
Kelowna’s CSI swung 18% between 2021-2023, reflecting shifting drug enforcement priorities. Meanwhile, Winnipeg maintains rates 34% above national averages due to organized crime pressures. These variations prove why per 100,000 metrics alone can’t capture localized risks.
Ontario’s suburban carjackings surged 41% last year as criminals target commuter vehicles. Such data trends help cities allocate police resources where they’re needed most. By tracking these patterns, communities develop targeted strategies rather than blanket solutions.
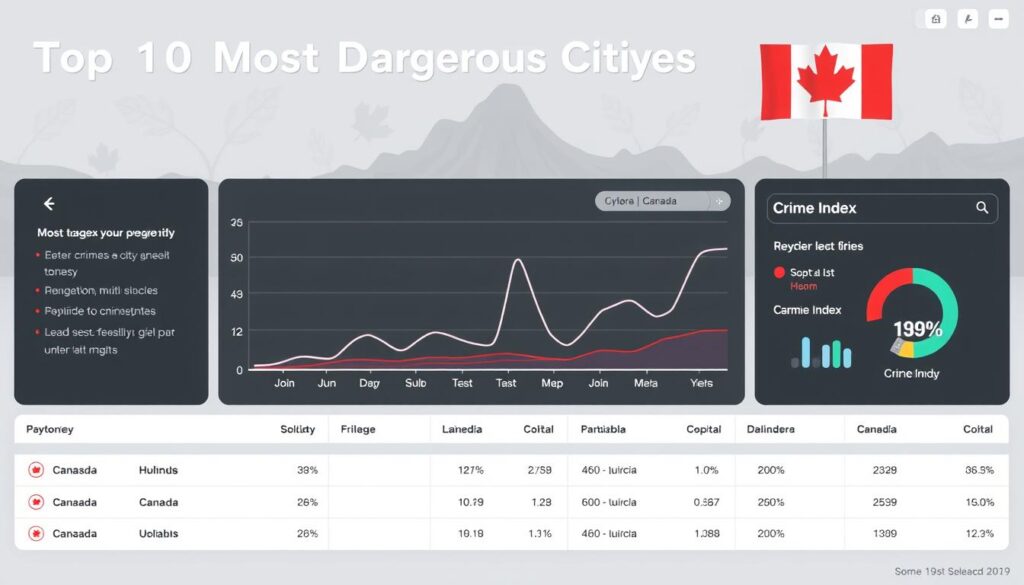
top 10 most dangerous cities in canada
Canada’s safest cities often overshadow areas where crime rates demand urgent attention. Three municipalities stand out for their distinct challenges, each reflecting how geography, economy, and social dynamics shape public safety outcomes.
Case Study: Surrey, Kelowna and Greater Sudbury

Surrey’s 64.7 Crime Index stems from gang conflicts and rapid urban expansion. With 32,053 police calls per 100,000 people last year, this metro area saw violent offences jump 14%—directly tied to drug distribution networks along Highway 99.
Kelowna’s 62.1 Index masks a paradox. Tourism revenue fuels growth, yet 9,423 annual incidents per 100,000 residents reveal strained resources. Seasonal population spikes complicate theft prevention in vacation hotspots.
Greater Sudbury’s 61.9 Index reflects its mining legacy. Violent crimes here outpace property offences 2:1, a pattern rooted in economic transitions. Former industrial workers face higher risks of substance-related incidents compared to national averages.
Comparing Violent and Property Crime Rates
Surrey’s property crimes dominate headlines, but its 22% rise in assaults demands equal attention. Contrast this with Winnipeg’s 60.5 Index, where homicides hit 5.04 per 100,000 people—Canada’s highest rate outside major metros.
Consider these 2023 patterns:
- Vehicle thefts tripled national averages in Brampton (55.3 Index)
- Break-ins decreased 8% in London (53.9 Index) through neighborhood watch programs
- Fraud reports spiked 31% in Regina (53.4 Index), targeting elderly residents
These variations prove that localized strategies outperform blanket approaches. Understanding whether a city struggles more with violent or property crime determines where to allocate patrols, social services, and prevention funding.
Regional Variations in Crime Across Canadian Provinces
Canada’s vast geography creates striking contrasts in community safety. While eastern provinces often show lower crime rates, western regions face unique pressures that reshape urban security landscapes. Let’s explore how provincial differences in economics, infrastructure, and law enforcement create these disparities.
Western Canada Hotspots and Provincial Differences
British Columbia and Alberta account for 40% of Canada’s high crime urban centers despite housing 25% of the population. Their CSI scores (92.9 and 101.4 respectively) reflect challenges like:
- Drug trafficking through Vancouver’s ports
- Worker influxes during oil sands booms
- Gang disputes over suburban territories
Resource-dependent economies amplify risks. “Temporary workers in Alberta’s camps report 23% more theft incidents than permanent residents,” notes a 2023 Royal Canadian Mounted Police analysis. Seasonal employment patterns leave areas understaffed for crime prevention during economic downturns.
Border proximity plays a key role. Cities near the U.S. frontier see 18% higher vehicle theft rates than inland counterparts. Transportation corridors like Highway 1 become crime arteries, moving stolen goods between provinces.
Law enforcement strategies vary widely. Saskatchewan spends 34% more per capita on policing than Ontario, yet maintains a CSI nearly triple its eastern counterpart. These differences highlight how provincial priorities shape community safety outcomes.
Effective Safety Measures and Community Responses
Protecting neighborhoods requires both personal vigilance and collective action. Recent data shows communities combining individual safety practices with organized prevention strategies reduce criminal incidents by up to 37%.
Practical Safety Tips for Residents
Start by hardening your home’s defenses. Install Grade 1 deadbolts and motion-activated lighting—these deter 83% of break-in attempts according to RCMP analysis. For vehicle security:
- Park in well-lit lots with surveillance cameras
- Use steering wheel locks and disable keyless entry at night
- Never leave packages or electronics visible inside
Adjust daily routines to minimize risks. Walk confidently in areas with high foot traffic, and share your location when traveling after dark. A 2023 Calgary study found residents who avoid isolated shortcuts reduce assault exposure by 29%.

Community Policing and Prevention Initiatives
Neighbourhood Watch groups with regular patrols cut property crime by 16% in Edmonton last year. Many cities now deploy hybrid models blending officer patrols with social workers. “Mental health teams resolve 42% of non-violent calls without arrests,” notes a Vancouver Police Board report.
Successful programs include:
- Indigenous-led patrols addressing root causes in Winnipeg
- Youth sports leagues reducing gang recruitment in Surrey
- SafeGrowth plans redesigning public spaces for natural surveillance
Report every incident—even minor vandalism—to help police identify patterns. Your input directly shapes where resources get deployed.
Emerging Trends and Future Crime Predictions in Canada
As Canada navigates evolving security challenges, new crime patterns are reshaping urban safety priorities. Technological shifts and demographic changes will redefine how communities address risks in coming years.
Evolving Urban Safety Metrics and Technological Impacts
Cybercrime now accounts for 27% of reported offences, with digital fraud cases doubling since 2020. Law enforcement agencies increasingly use predictive algorithms to identify hotspots, though online drug markets complicate these efforts. You’ll see cities adopt dynamic crime severity index models that weigh cyber threats alongside physical risks.
Aging populations and immigration patterns alter vulnerability profiles. Urban centers with rapid growth face 18% higher fraud rates, while rural areas grapple with resource-related thefts. Climate-induced displacements may strain social services, creating new pressure points for criminal activity.
Policy reforms aim to balance prevention and adaptation. Housing initiatives targeting high-risk neighborhoods could reduce break-ins by 14%, while updated crime severity index analysis tools help allocate resources effectively. Your community’s safety will depend on integrating these strategies with localized needs.

