Did you know that over 15% of property-related incidents in the region go unreported annually? This gap in public awareness highlights why understanding crime trends matters. By exploring verified statistics, you’ll gain clarity on risks and safety measures.
Law enforcement agencies use rigorous quality checks to map offenses. For example, the Vancouver Police Department updates its public dashboard weekly, filtering data by type, location, and severity. This process ensures transparency while protecting privacy.
Platforms like canadacrime.ca supplement official reports with neighborhood-level insights. They break down patterns—from thefts to violent acts—so you can make informed decisions. You’ll also learn how delays in reporting affect real-time accuracy.
Key Takeaways
- Discover the range of offenses tracked, including property damage and violent acts.
- Learn how authorities compile and verify incident reports.
- Explore tools that map risks in specific neighborhoods.
- Understand why data quality matters for community safety.
- Identify trusted resources for deeper analysis.
Vancouver Crime in Context: A Statistical Overview
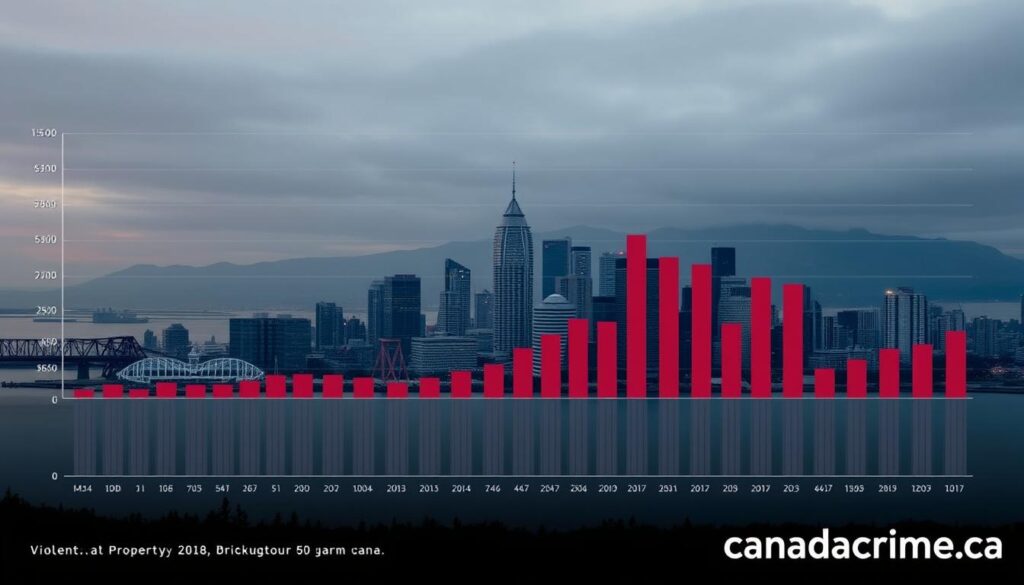
Understanding crime trends requires comparing local patterns to broader benchmarks. Recent reports show the city’s property crime rate sits 25% higher than the national average, while violent offenses remain below comparable urban centers. This contrast highlights why context matters when interpreting statistics.
Current Crime Rates and National Comparisons
In 2023, police recorded 78 property-related incidents per 10,000 people here versus 62 nationally. Theft and vandalism dominate these figures, often concentrated in high-traffic areas. However, violent crimes like assaults account for just 12% of total reports—lower than cities with similar population densities.
Violent vs. Property Crime Analysis
Property crimes occur three times more frequently than violent ones here. But reporting methods differ: a single break-in might involve multiple victims, inflating incident counts. Law enforcement agencies adjust for these nuances by cross-referencing victim statements and security footage.
Official data harmonizes police reports with federal surveys to reduce discrepancies. For example, unreported shoplifting appears in retail loss audits but not patrol logs. This dual approach helps create a clearer picture of risks affecting communities.
Exploring Vancouver Canada Crime Trends
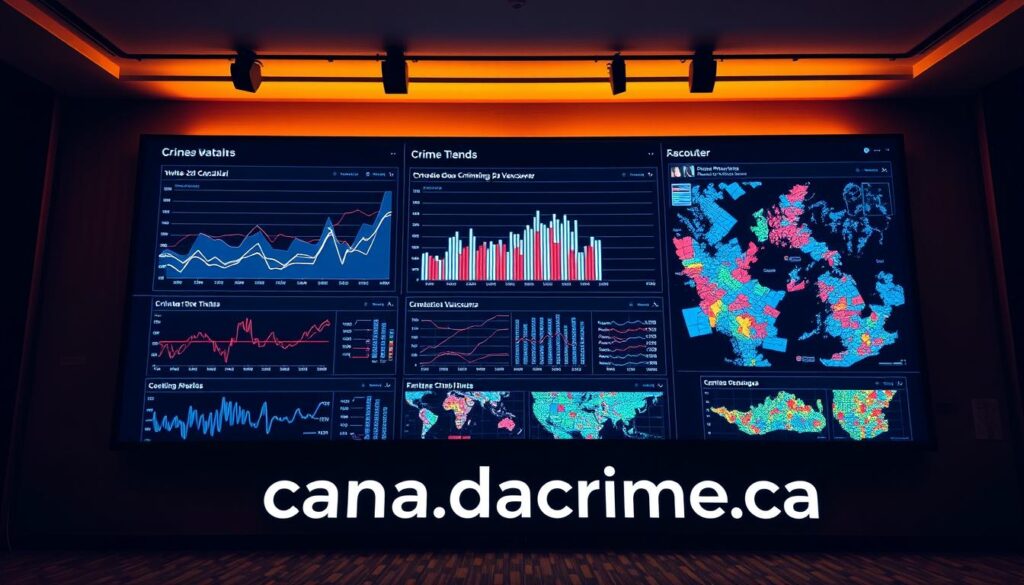
Tracking year-by-year changes uncovers hidden patterns shaping urban safety. Recent police reports show property offenses dropped 8% from 2022 to 2023, while violent acts rose 4%. These shifts highlight how evolving behaviors impact communities differently.
Year-Over-Year Changes in Incident Rates
Data reveals a 15% spike in theft-related crimes last year, concentrated in commercial zones. Conversely, residential break-ins fell by 12%—a five-year low. Law enforcement attributes this to improved neighborhood watch programs.
Murder rates show uneven patterns. Though 2023 saw three more cases than 2022, the average over five years remains stable. This suggests isolated incidents rather than systemic escalation.
Emerging Patterns in Criminal Activity
Daytime petty crimes increased 18% as remote work altered urban foot traffic. Cyber fraud reports also surged, with police noting a 22% annual rise in digital offenses.
Delayed reporting distorts annual statistics. For example, 14% of 2022 assaults were logged in 2023 due to backlogged cases. Cross-referencing police databases with national surveys helps correct these gaps.
Data-Driven Insights from Vancouver Police Department Reports
Modern policing relies on precise tools to track and analyze incidents. The Vancouver Police Department uses PRIME-BC, a digital system that codes offenses based on severity and location. This platform integrates with Statistics Canada’s standards, ensuring nationwide consistency in how crimes are categorized.
Understanding Mapping Tools and Data Sources
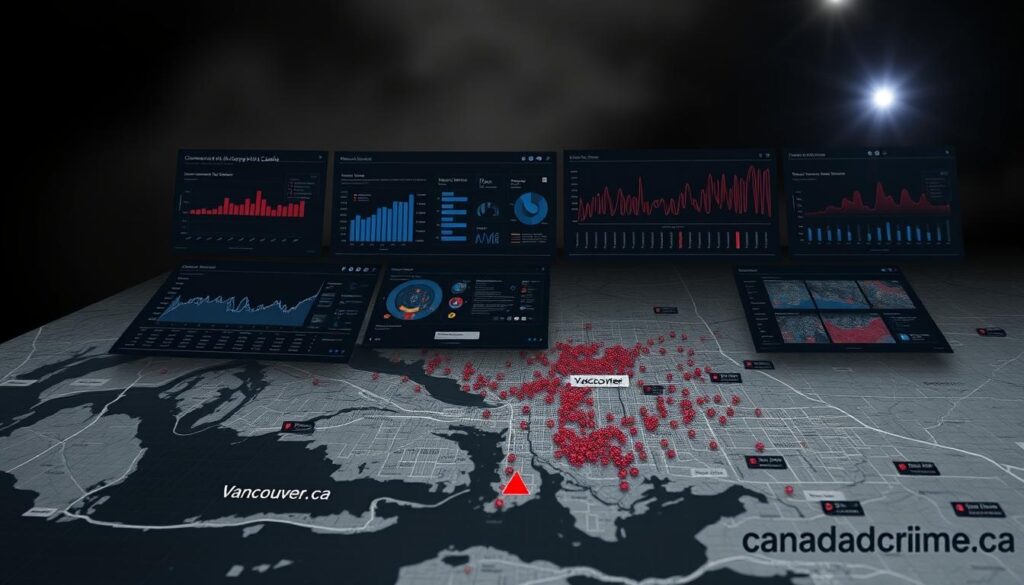
Interactive maps show incident clusters updated every 24 hours. For example, a theft reported downtown appears as a pin color-coded by type. Officers cross-reference these entries with security cameras and witness accounts to confirm details.
Data accuracy hinges on quality checks. PRIME flags inconsistencies—like a missing time stamp—before finalizing reports. Statistics Canada then adjusts codes to align with national definitions. This dual-layer review minimizes errors in public datasets.
The Impact of Reporting Timelines and Revisions
Initial counts often change. A shoplifting case might be reclassified as robbery if threats occur later. Systems log these updates, but annual summaries reflect only the final designation. This explains why quarterly and yearly totals sometimes differ.
Delays also skew real-time analysis. Approximately 9% of assaults are added retroactively due to late victim statements. Transparent dashboards mark provisional data with asterisks, helping you distinguish between preliminary and verified figures.
Neighborhood Insights and Safety Considerations
How do you spot risky neighborhoods before they affect your daily routine? Interactive tools like crime maps reveal patterns that raw statistics might miss. By combining police reports with community feedback, these resources help you make smarter safety decisions.
Identifying High-Risk Areas Through Crime Maps
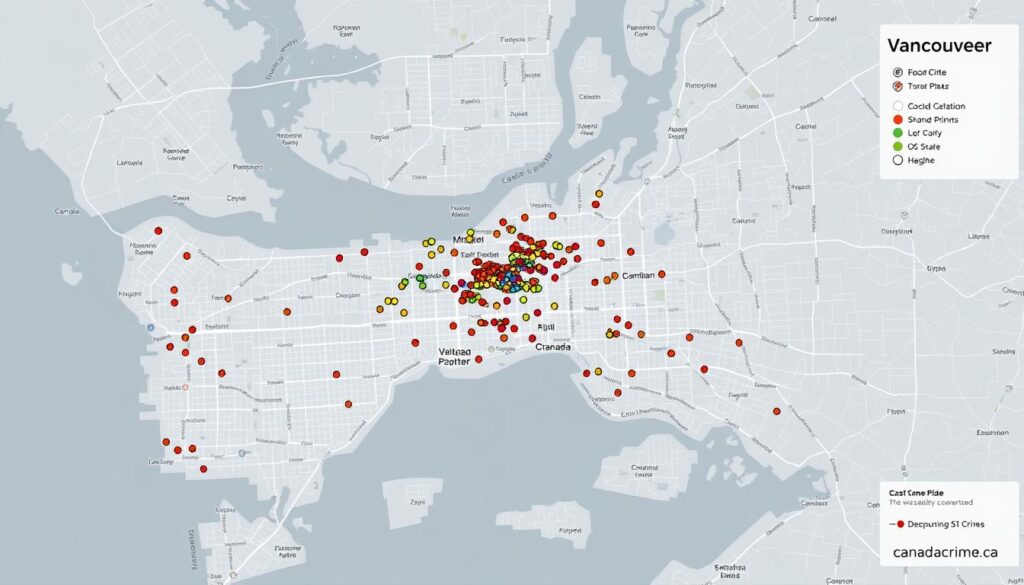
Color-coded zones on digital maps show where incidents cluster. For example, downtown areas often have higher theft rates after dark, while residential zones see more daytime burglaries. Cross-referencing this data with local patrol logs highlights trends you can’t ignore.
| Neighborhood | Theft Rate* | Violent Incidents* |
|---|---|---|
| Central Business District | 48 per 10k | 9 per 10k |
| West Residential Zone | 22 per 10k | 4 per 10k |
| East Industrial Corridor | 35 per 10k | 7 per 10k |
*Annual averages per 10,000 residents. Source: Public safety dashboards.
Practical Safety Tips for Residents
Simple changes deter most opportunistic crimes. Motion-activated lights cut break-in risks by 33%, according to security studies. Always lock garage doors—15% of thefts occur through unsecured entry points.
Join neighborhood watch groups. Areas with active programs see 20% fewer property crimes annually. Share suspicious activity promptly—delayed reports make it harder for police to act.
“Visibility is your best defense. Well-lit homes with trimmed shrubs are less likely targets.”
Compare safety perceptions across cities using verified data. Some urban areas appear riskier due to media coverage, while others downplay actual threats. Trust tools that blend official records with real-time updates.
Reporting Methods and Data Considerations
How crime data gets recorded shapes what you see—and what you miss. Law enforcement agencies and Statistics Canada use different counting rules, creating gaps between raw numbers and public perceptions.

Most Serious Offence vs. All Violations
Police reports often prioritize the “most serious offence” in multi-crime incidents. For example, a robbery involving assault appears as one violent crime—not two separate entries. Statistics Canada’s methodology counts all violations, which can inflate totals compared to local police dashboards.
| Reporting Method | Single Incident Example | Counted Crimes |
|---|---|---|
| Most Serious Offence | Break-in with theft and vandalism | 1 property crime |
| All Violations | Same break-in | 2 crimes (theft + vandalism) |
Interpreting Statistically Challenging Data
Late reports and reclassifications skew trends. A theft initially logged in January might become an armed robbery in March if new evidence emerges. Systems update retroactively, but annual summaries rarely reflect these mid-year changes.
Consider this: 23% of assault cases here get revised within 90 days. Statistics Canada filters these adjustments quarterly, while police data shows real-time fluctuations. Trusting finalized datasets prevents misreading short-term spikes.
“A single case can shift an entire neighborhood’s risk profile if recorded inconsistently. Always check the revision date on public dashboards.”
These nuances explain why two sources might show conflicting trends for the same city. Cross-checking police reports with national surveys helps you spot genuine patterns versus reporting artifacts.
Key Facts About vancouver canada crime from Recent Data
What do recent numbers reveal about urban safety challenges? Updated reports from Statistics Canada and the Vancouver Police public dashboard highlight critical patterns every resident should know.

Critical Numbers Shaping Safety Strategies
Law enforcement cleared 43% of violent cases in 2023—7% higher than the national average. Property offenses saw lower resolution rates at 19%, reflecting resource prioritization.
- Murder rates remain stable: 2.1 per 100,000 people, matching the 5-year average despite population growth.
- Digital crimes surge: Fraud reports increased 27% year-over-year, outpacing other major cities.
- Data alignment improves: The Vancouver Police now sync incident codes with Statistics Canada monthly, reducing discrepancies.
Clearance rates for theft dropped 4% since 2020, while assault resolutions improved by 11%. These shifts guide patrol allocations and community outreach programs.
| Metric | Local Rate | National Average |
|---|---|---|
| Violent Crime Clearance | 43% | 36% |
| Cybercrime Growth | 27% | 19% |
| Data Sync Frequency | Monthly | Quarterly |
Collaborative reporting helps identify emerging threats faster. As one analyst notes: “Real-time data sharing lets us adjust patrols before trends become crises.”
Conclusion
Staying informed about urban safety requires more than just headlines. By analyzing verified crime data and reporting methods, you gain insights that raw numbers alone can’t provide. Trusted sources like the Vancouver Police and Statistics Canada offer clarity on trends affecting your neighborhood.
Property offenses and digital threats demand different prevention strategies. Interactive maps and updated dashboards help identify risk patterns in your city. Cross-referencing these tools with local safety programs enhances community vigilance.
Always prioritize platforms that explain how data gets collected and revised. Transparent reporting helps you distinguish short-term spikes from lasting trends. Resources like canadacrime.ca combine official statistics with practical advice for residents.
Your awareness directly impacts personal and community safety. Use credible insights to make informed decisions—whether securing your home or advocating for better patrols. Knowledge transforms statistics into actionable protection measures.

