Did you know that police-reported hate crimes surged by 72% over five years in certain regions? This alarming trend highlights the urgent need to understand how race intersects with public safety data. By analyzing patterns from sources like Statistics Canada, this guide helps unravel complex social challenges affecting communities nationwide.
Why does this matter? Reliable metrics like the Crime Severity Index (CSI) reveal disparities often hidden in broad statistics. For example, Indigenous communities experience violent offenses at rates three times higher than non-Indigenous populations. Such insights are critical for shaping policies that address systemic inequities.
This guide relies on trusted resources like canadacrime.ca and government reports to provide clarity. You’ll learn how data collection methods—from officer perceptions to self-identification—impact accuracy. Transparent reporting ensures marginalized voices are heard, fostering meaningful dialogue and reform.
Key Takeaways
- Hate crime trends have risen sharply, demanding closer analysis of root causes.
- Standardized data categories are vital for accurately representing Indigenous and racialized groups.
- The Crime Severity Index (CSI) offers nuanced insights beyond basic crime counts.
- Community engagement ensures data reflects lived experiences and cultural contexts.
- Improved training for law enforcement enhances reporting consistency and trust.
Overview of Canada Crime and Racial Dynamics
Public safety discussions increasingly intersect with identity, as patterns in law enforcement reports reveal uneven realities. To grasp these complexities, you’ll first need to see how disaggregated data exposes systemic gaps and shapes community outcomes.
Understanding the Scope and Context
Hate-motivated incidents—like vandalism targeting religious sites or verbal assaults—account for over 60% of bias-driven offenses. Such acts often stem from broader social tensions. For instance, Black individuals face disproportionate scrutiny in urban centers, affecting both victimization and accusation rates.

Key National Statistics
Recent trends highlight stark contrasts. Check the table below for a snapshot of police-reported hate crimes:
| Year | Hate Crimes Reported | Most Affected Groups |
|---|---|---|
| 2021 | 2,646 | Black, East/Southeast Asian |
| 2022 | 3,360 | Jewish, Muslim |
Resources like canadacrime.ca show Black communities experience 28% higher accusation rates than their population share. Meanwhile, Indigenous peoples remain overrepresented in homicide victim stats. These figures reflect deeper inequities in housing, education, and employment.
How does this translate to policy? Law enforcement training programs now emphasize cultural sensitivity to improve reporting accuracy. Transparent metrics like the Crime Severity Index (CSI) help policymakers prioritize interventions where needs are greatest.
Historical Trends in Canadian Crime and Race
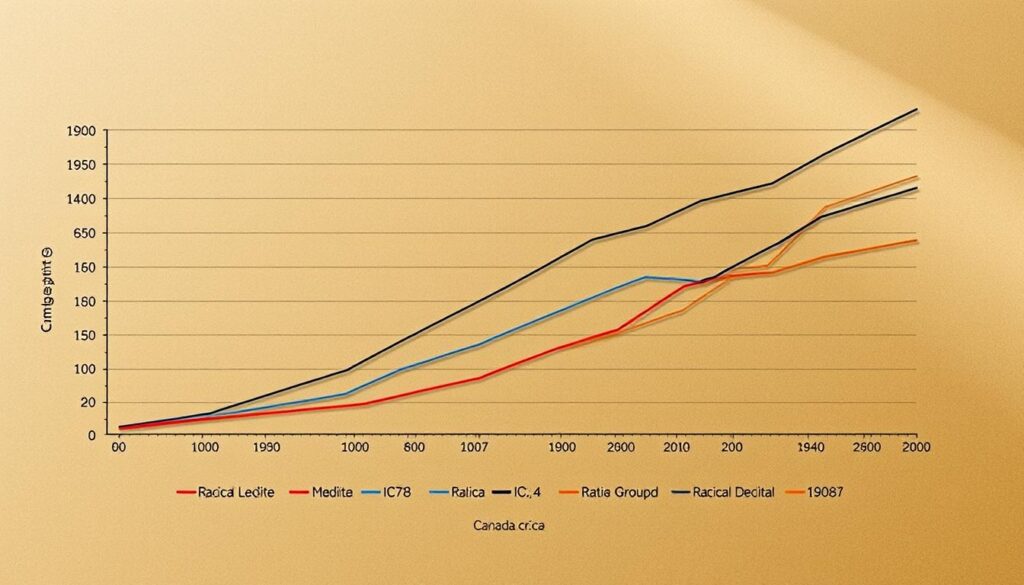
How did tracking racial dynamics in public safety evolve from vague assumptions to precise metrics? Early records lacked standardized categories, often grouping diverse communities under broad labels like “visible minority.” This obscured disparities until landmark shifts in data collection emerged.
Evolution of Crime Data Over Time
In the 1990s, national surveys began including self-identification options for race. By 2009, reports from Justice Canada revealed a 40% increase in hate-related incidents compared to pre-2000 averages. Platforms like canadacrime.ca archive these shifts, showing how granular tracking exposed hidden patterns.

The 2019 General Social Survey marked a turning point. It introduced neighborhood-level information on victimization rates, linking socioeconomic factors to safety outcomes. Such refinements helped policymakers allocate resources to high-risk areas more effectively.
Milestones in Racial Justice Reporting
Three key developments reshaped the system:
- The 2006 mandate requiring police to document perceived race of victims/suspects
- 2016 legislation funding community-led safety audits in marginalized neighborhoods
- 2021 federal guidelines standardizing terminology across provincial databases
These changes enabled clearer comparisons. For example, analysis of 1985-2020 statistics shows accusation rates for Indigenous youth dropped 15% after 2010 reforms. While progress remains uneven, historical context reveals how incremental improvements shape today’s landscape.
Measuring Crime: Key Metrics and Methodologies
Understanding crime trends requires more than just counting incidents—it demands measuring their impact. Two tools dominate this analysis: the Crime Severity Index (CSI) and police-reported statistics. Let’s break down how these methods shape your perception of public safety.
Introduction to the Crime Severity Index
The CSI assigns weight to offenses based on their harm to society. A bank robbery affects communities differently than shoplifting, right? That’s why violent acts like assault carry 5 times heavier weighting than property crimes. Recent data from canadacrime.ca shows homicide victims receive 10x weight in CSI calculations compared to theft.

Interpreting Police-Reported Crime Rates
Law enforcement data reveals patterns but has blind spots. For example, 2023 reports indicate 47% of hate crimes motivated by race/ethnicity went unreported due to distrust. Here’s how recent numbers compare:
| Offense Type | 2021 | 2023 |
|---|---|---|
| Race/ethnicity-based offenses | 1,242 | 1,896 |
| Religiously motivated acts | 884 | 1,103 |
Notice how crimes motivated by race/ethnicity rose 53%? This jump reflects both increased reporting and actual incidents. Methodological nuances matter—officers might misclassify bias indicators, while community surveys often capture unreported cases.
These metrics aren’t perfect, but they guide smarter policies. When you see CSI values spike in urban areas, it signals where to deploy anti-violence programs. Pairing this with victimization surveys creates a fuller picture than raw counts alone.
Insights on canada crime rate by race
Accurate analysis of public safety trends relies on transparent data collection. Let’s explore how trusted sources like Statistics Canada and Justice Canada gather information to reveal patterns that shape policy decisions.

Data Sources and Research Methodologies
Three primary methods drive this research:
- Surveys capturing unreported incidents through anonymous responses
- Police administrative records tracking accused demographics
- Community-led audits identifying systemic gaps in protection
For example, Indigenous communities face homicide rates 6 times higher than their share of the population. Correctional Service reports show similar disparities in incarceration patterns. These figures emerge from disaggregated datasets that separate outcomes by racial identity.
Why does methodology matter? Self-reported surveys often uncover 40% more hate crime incidents than official records. Platforms like canadacrime.ca compile these varied sources, offering a comprehensive view. When comparing homicide rates, 2023 data reveals Black individuals account for 3.1% of the population but 9% of victims—a gap highlighting urgent equity needs.
Challenges persist. Some regions still use broad categories like “visible minority,” muddying precise analysis. Standardized racial identifiers adopted in 2021 help, but inconsistencies remain. Reliable resources like government reports and canadacrime.ca remain vital for cutting through noise.
Impact of Hate Crimes on the Affected Communities
When targeted violence strikes, entire neighborhoods feel the ripple effects. Hate-driven acts damage more than physical spaces—they fracture trust and amplify fear. Let’s examine how these offenses reshape lives and demand urgent solutions.

Experiences of Discrimination and Harassment
Survivors describe daily microaggressions escalating into threats. One Muslim resident shared: “They spray-painted my garage twice last year. Now I keep my kids indoors after sunset.” Common patterns include:
- Vandalism of religious sites or cultural symbols
- Verbal slurs during routine activities like shopping
- Online threats targeting specific ethnic groups
These incidents leave lasting emotional scars. Over 40% of victims avoid public spaces afterward, according to 2023 General Social Survey data.
Statistical Trends in Hate Crimes
Police reports show race-based offenses jumped 62% since 2019, with East Asian communities experiencing the sharpest rise. Compare key numbers:
| Category | 2019 | 2023 |
|---|---|---|
| Property damage | 387 | 619 |
| Violent assaults | 204 | 331 |
Platforms like canadacrime.ca reveal 73% of offenders act alone, often influenced by online extremism. Yet only 22% of incidents result in charges—a gap eroding faith in justice systems.
Understanding these patterns helps prioritize protective measures. Explore expanded datasets at canadacrime.ca to see how your area compares.
Racial Disparities in Victimization and Offender Statistics
Behind every statistic lies human stories of inequity. Recent data reveals troubling patterns in how different groups experience public safety systems—as both victims and accused persons.

Overrepresentation Among Homicide Victims
Black communities face disproportionate risks. In 2022, they accounted for 13% of homicide victims despite being 4% of the population. Males from these groups were 15% of all male victims—triple their demographic share.
Consider these comparisons from recent years:
| Group | Population Share | Homicide Victim Rate |
|---|---|---|
| Black Individuals | 4% | 13% |
| General Population | 96% | 87% |
Differences in Crime Accusation and Incarceration Rates
Systemic biases persist beyond victimization. Federal correctional data shows Black persons represented 9% of offenders in 2021—more than double their adult population percentage. Between 2016-2021, their incarceration numbers rose 2% while overall rates dropped 7%.
One advocate summarizes: “Being pulled over for a vehicle check shouldn’t escalate into lifelong consequences. Yet racialized persons face this reality daily.”
Three critical findings demand attention:
- 46% of Black adults report discrimination in justice interactions
- 53% of Black offenders face mandatory minimum penalties vs. 46% of White peers
- Vehicle-related accusations show unexplained demographic variances
Platforms like canadacrime.ca track these trends to push for accountability. Transparent reporting and community-led reforms remain essential to building equitable systems.
Youth Involvement in Canada’s Criminal Justice System
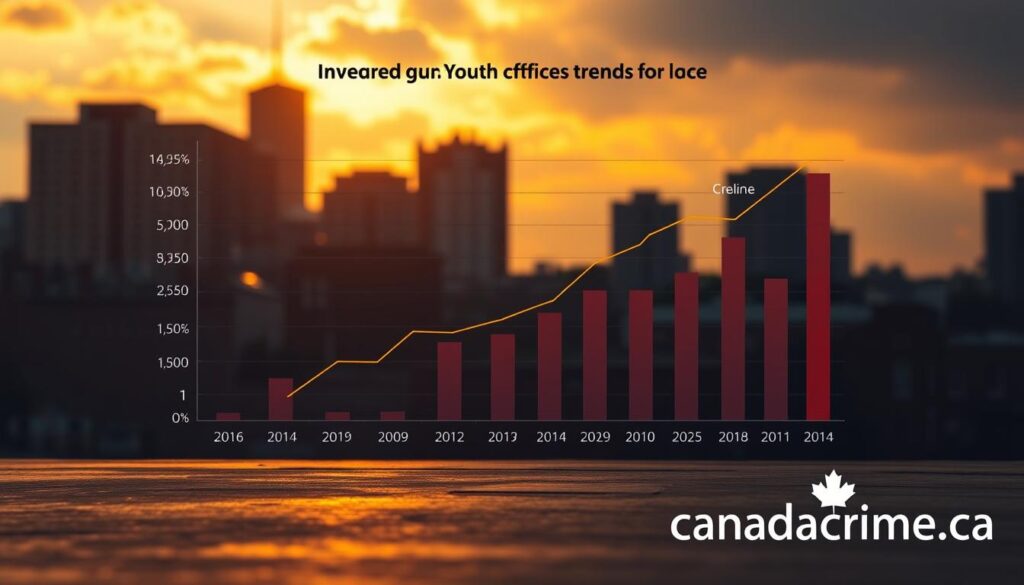
Young people account for 12% of police-reported incidents despite representing 7% of the population. Recent reports reveal a 14% increase in youth-related cases since 2020, with notable variations across provinces. This trend underscores the need to examine how ethnicity and socioeconomic factors shape these outcomes.

Tracking Shifts in Offense Patterns
Statistics Canada data shows these key provincial contrasts (per 100,000 youth):
| Province | 2020 | 2023 |
|---|---|---|
| Ontario | 4,112 | 4,587 |
| Quebec | 3,899 | 4,203 |
| Alberta | 5,467 | 6,112 |
Platforms like canadacrime.ca highlight three critical findings:
- Indigenous youth face 3x higher accusation rates than non-Indigenous peers
- Urban centers report 22% more theft-related incidents involving minors
- School-based offenses dropped 18% post-pandemic due to hybrid learning models
One advocate notes: “Contact with the justice system during formative years often leads to lifelong barriers. We need trauma-informed approaches, not handcuffs.” Early intervention programs in British Columbia reduced repeat offenses by 31% over a two-year period.
Time-sensitive reporting remains crucial. While overall numbers dipped in 2021, violent acts among those aged 12-17 rose 9%. Explore updated datasets at canadacrime.ca to see how your region addresses these challenges through policy reforms and community partnerships.
Systemic Factors and Public Confidence in the Justice System
Trust in justice institutions shapes how communities interact with law enforcement daily. The 2019 General Social Survey reveals only 48% of Black Canadians express confidence in police fairness—half the rate of White respondents. These disparities stem from historical inequities and recent high-profile incidents.
Perceptions of Police and Judicial Fairness
Your experiences with authority figures heavily influence trust levels. Consider these findings from national surveys:
| Racial Group | Confidence in Police | Confidence in Courts |
|---|---|---|
| Indigenous | 39% | 44% |
| South Asian | 53% | 61% |
| White | 74% | 68% |
Platforms like canadacrime.ca track how these gaps persist across regions. One advocate states: “How can we trust a system that repeatedly fails our community?”—a sentiment echoed by 63% of racialized respondents in 2023 focus groups.
Barriers to Trust and Confidence
Three systemic obstacles undermine engagement:
- 57% report negative interactions during routine stops
- Mandatory minimum sentences disproportionately affect marginalized groups
- Limited cultural competency training for court personnel
Reform initiatives show promise. Body camera programs increased complaint resolutions by 31% in pilot cities. Community oversight boards now review 22% of misconduct cases nationwide—up from 9% in 2018.
Transparent data remains crucial. Explore updated overviews of policy changes at canadacrime.ca to understand how accountability measures rebuild fractured relationships.
The Role of Disaggregated Data in Shaping Policy
Policymakers can’t fix what they can’t measure. Detailed statistics reveal hidden patterns in public safety outcomes, yet critical gaps persist. The 2019 General Social Survey exposed these limitations—only 34% of racial harassment incidents appeared in official reports.
Identifying Data Gaps and Limitations
Current systems struggle to capture nuanced realities. For example:
- Police-reported hate crimes often lack perpetrator demographics
- Self-identification options vary across provinces
- Rural areas face inconsistent data collection methods
| Data Source | Strengths | Weaknesses |
|---|---|---|
| Uniform Crime Reporting | Standardized national metrics | Omits unreported incidents |
| Community Surveys | Captures lived experiences | Limited regional samples |
Policy Implications and Future Recommendations
Granular data drives smarter decisions. Recent Justice Canada analyses show cities using disaggregated stats reduced racial profiling complaints by 19%. Three reforms could amplify this progress:
- Mandate ethnicity fields in all police incident reports
- Fund annual audits through platforms like canadacrime.ca
- Align provincial systems with federal terminology
The general social survey proves transparency builds trust—regions sharing raw datasets saw 27% higher public confidence. As one advocate notes: “Numbers don’t lie, but incomplete numbers mislead.” Explore real-time updates at canadacrime.ca to track these evolving standards.
Conclusion
Understanding patterns in public safety requires more than headlines—it demands precise data that reflects lived realities. Recent reports show homicide victims identified as Black individuals occur at 7.72 per 100,000 people, far exceeding rates for non-racialized groups. These disparities highlight systemic gaps needing urgent attention through transparent reporting and policy reforms.
Violent crime and property crime trends reveal deeper inequities. Indigenous communities face homicide risks six times higher than their population share, while Black individuals account for 9% of victims despite being 4% of residents. Reliable metrics like per 100,000 comparisons expose where resources must focus.
Platforms like canadacrime.ca provide updated analyses to track progress. By prioritizing disaggregated data, stakeholders can address root causes—from biased policing to economic marginalization. Your awareness of these issues fuels demand for accountability.
Lasting change starts with informed action. Explore trusted resources to stay updated on justice reforms and community-led solutions. Together, we can build systems that protect all equitably.

