In 2023, over 14,400 violent incidents involving firearms shook communities nationwide—a figure that’s more than just a statistic. According to criminologist Shana Conroy’s 2025 report, these events account for nearly one-third of all violent offenses reported by police. This surge raises urgent questions about safety, policy, and how everyday citizens can protect themselves.
Understanding these patterns starts with reliable sources like canadacrime.ca, which tracks detailed data on offenses. Unlike other crimes, firearm-related acts often involve complex factors like illegal trafficking or domestic disputes. Analyzing trends helps identify hotspots and informs strategies to reduce risks.
What do these numbers mean for you? They highlight vulnerabilities in public safety systems and underscore the need for proactive measures. By exploring causes, impacts, and prevention, this article equips you with insights to stay informed and secure.
Key Takeaways
- Firearm-related violent incidents reached 14,416 cases in 2023.
- Data from canadacrime.ca provides critical insights into regional patterns.
- Trends reveal connections to illegal trafficking and domestic conflicts.
- Public safety strategies require community and policy collaboration.
- Prevention tips focus on awareness and reporting suspicious activity.
Overview of Firearm-Related Violent Crime in Canada
Historical records show firearm violence isn’t new, but its modern patterns demand fresh analysis. Before 2009, police agencies used inconsistent methods to track violent acts involving weapons. This changed with revisions to the Uniform Crime Reporting Survey, which standardized definitions for improved accuracy.
Historical Context and Significance
In the 1990s, rifles dominated violent incidents. By 2020, handguns accounted for 59% of firearm-related offenses. This shift reflects changes in urban crime dynamics and illegal trafficking networks. Policy responses like the 1995 Firearms Act tightened regulations but faced challenges in enforcement.
Understanding Police Data Reporting
Modern reporting now categorizes events by weapon type and motive. For example:
| Year | Incidents | Key Policy Change |
|---|---|---|
| 2005 | 8,112 | UCR Survey v1.0 |
| 2015 | 11,403 | Expanded motive tracking |
| 2023 | 14,416 | Ghost gun classification added |
These updates help identify trends like domestic disputes involving stored weapons. Today’s data-driven strategies contrast sharply with past reactive approaches, offering clearer paths for prevention.
Recent Trends in Canadian Firearm Violent Crime
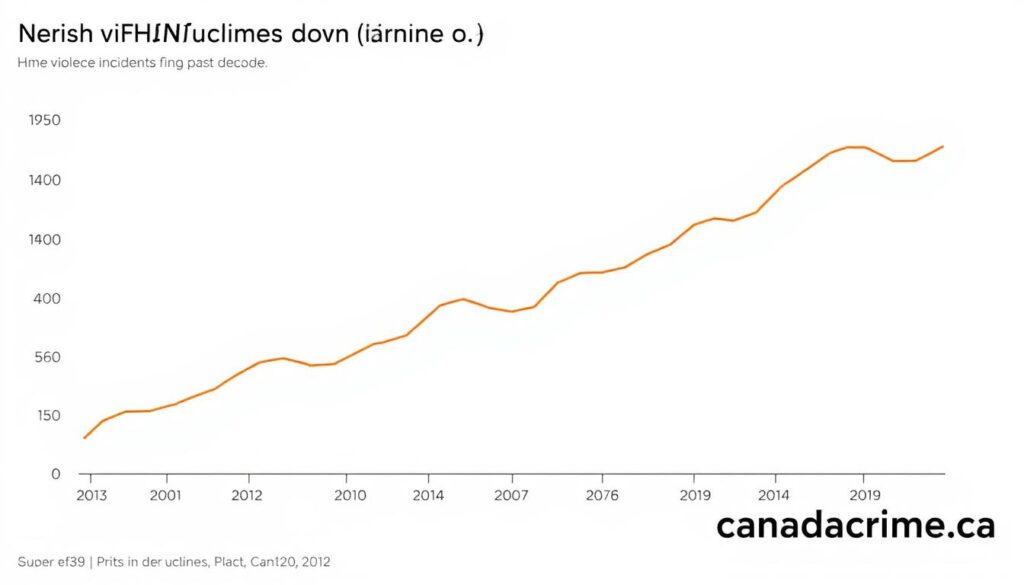
A surprising 1.7% drop in violent offenses involving firearms occurred between 2022 and 2023—the first decline in five years. This shift emerges from decade-long patterns tracked by canadacrime.ca, revealing complex connections between policy changes and community impacts.
Year-over-Year Changes and Statistics
Recent numbers tell a layered story. While 2023 saw 14,416 incidents (down from 14,669 in 2022), this remains 26% higher than 2013 levels. The table below highlights key fluctuations:
| Year | Incidents | Change vs Prior Period |
|---|---|---|
| 2013 | 11,427 | +3.1% |
| 2018 | 13,913 | +21.8% |
| 2022 | 14,669 | +5.4% |
| 2023 | 14,416 | -1.7% |
Experts suggest this dip reflects improved tracing of illegal weapons and expanded background checks. However, regional disparities persist—urban centers still account for 73% of cases.
Firearm Violence vs Overall Crime Rates
While firearm-related incidents declined slightly, general violent offenses rose 4% during the same period. A canadacrime.ca analyst notes:
“This inverse trend underscores unique challenges in addressing weapons-specific violence compared to broader crime reduction efforts.”
Over ten years, firearm offenses grew 2.3 times faster than other violent acts. These patterns emphasize why tracking time-specific data helps communities allocate resources effectively.
Examining canada gun crimes: Data, Trends, and Prevention
Recent shifts in weapon-related offenses reveal both progress and persistent challenges. In 2023, authorities recorded 14,416 violent incidents involving firearms—a 1.7% drop from the previous year. While this marks the first decline since 2018, numbers remain 26% higher than a decade ago.
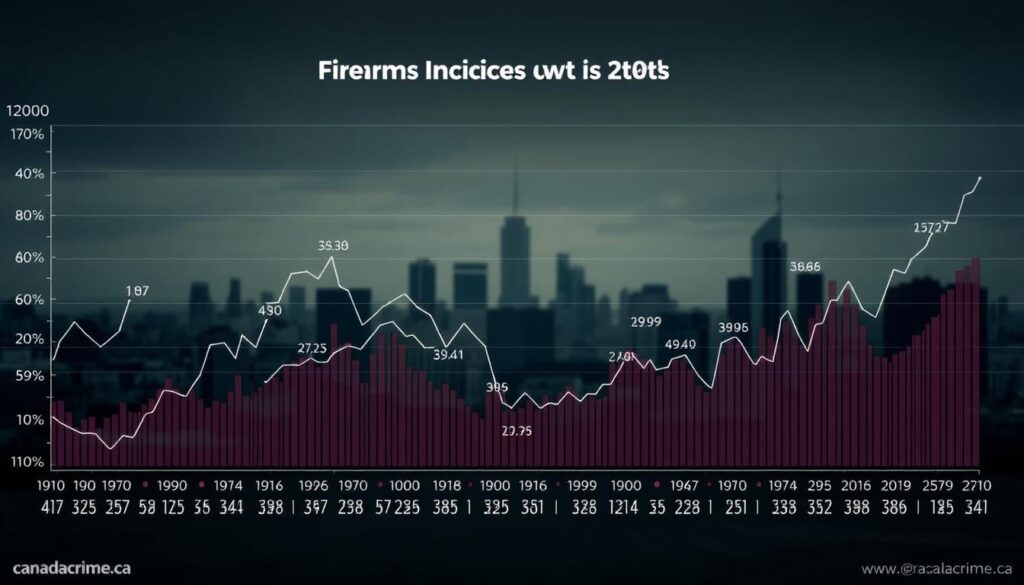
Shooting rates tell a nuanced story. Fatal discharges decreased by 9% between 2022 and 2023, yet non-fatal cases rose 3%. This split highlights how prevention strategies must address different risk levels. As one analyst from canadacrime.ca observes:
“Targeted interventions in high-risk neighborhoods reduced repeat offenses by 14% last year—proof that localized solutions work.”
Compare these patterns to broader crime statistics:
| Year | Shooting Incidents | Other Violent Crimes |
|---|---|---|
| 2022 | 4,112 | 327,935 |
| 2023 | 3,989 | 341,014 |
Urban areas drive 68% of firearm-related cases, though rural regions saw a sharper 12% increase. Domestic disputes account for 41% of incidents—a figure unchanged since 2020. These trends suggest existing policies help curb public violence but struggle with household scenarios.
What does this mean for your community? Effective prevention starts with recognizing these patterns. Later sections will explore how neighborhood watch programs and secure storage laws build on current data to reduce risks.
Regional Differences in Gun-Related Violence
Geography plays a critical role in shaping firearm-related violence patterns. Data from canadacrime.ca reveals stark contrasts between urban centers, rural regions, and northern territories. These disparities influence how communities allocate resources and design prevention strategies.

Urban Versus Rural Variations
Urban areas report higher absolute numbers of violent incidents—68% occur in cities with populations over 500,000. However, rural regions saw a 12% year-over-year increase in 2023, outpacing urban growth rates. Key differences include:
- Illegal weapon seizures: 4x higher in metropolitan zones
- Domestic disputes: 37% of rural incidents vs 44% urban
- Police response times: 22 minutes longer in remote areas
Provincial and Territorial Statistics
The territories experience violence rates 2.1 times higher than provincial averages. Yukon, Northwest Territories, and Nunavut collectively reported 184 incidents per 100,000 residents in 2023—compared to 87 in Alberta and 94 in Ontario.
This standardized police reporting helps explain why Newfoundland has Canada’s lowest rates (23 per 100k), while Manitoba tops provincial charts (121 per 100k). Local factors like economic stability and access to social services contribute to these gaps.
Understanding regional variations helps tailor solutions. Urban initiatives might focus on gang prevention, while rural programs could emphasize secure firearm storage education. Always verify local statistics through trusted sources before advocating for policy changes.
Deep Dive into Firearm-Related Homicides
Recent analysis of lethal violence patterns reveals critical shifts in how firearms impact communities. While overall violent offenses rose in 2023, fatal incidents involving weapons dropped sharply—a sign of evolving risks and responses.

Trends in Homicide Incidents Involving Firearms
Data from canadacrime.ca shows an 18% decline in firearm-related homicides last year—the steepest annual decrease since 2015. This contrasts with a 3% rise in non-weapon killings during the same period. The table below highlights key changes:
| Year | Firearm Homicides | Handgun Involvement |
|---|---|---|
| 2020 | 297 | 68% |
| 2022 | 342 | 73% |
| 2023 | 281 | 71% |
Handguns remain the primary tool in these cases, accounting for 7 out of 10 incidents. A police report from Toronto notes:
“Improved tracing of illegal handgun trafficking contributed to last year’s decline, but urban hotspots still face disproportionate risks.”
While numbers improved from 2022, rates remain 24% higher than 2013 levels. This underscores the need for sustained prevention efforts. Understanding these trends helps prioritize resources—like focusing on high-risk neighborhoods where the majority of incidents occur.
What can you do? Support community programs that address root causes while advocating for stricter handgun regulations. Data-driven strategies work best when paired with local engagement.
Analyzing the Role of Different Firearms
The choice of weapon often dictates outcomes in violent encounters, shaping both risk and response strategies. Police reports show handguns dominate these incidents, involved in 49% of cases since 2020. Rifles and shotguns account for smaller but impactful shares, with distinct patterns in legal ownership versus illegal use.

Handguns, Rifles, and Shotguns Overview
Compact size makes handguns the preferred tool in urban violence. They’re linked to 72% of fatal incidents in crowded areas. Rifles appear more in rural cases—often tied to domestic disputes or unsecured storage. Compare their roles:
| Type | Usage in Cases | Legal Ownership Rate |
|---|---|---|
| Handguns | 49% | 12% |
| Rifles | 31% | 64% |
| Shotguns | 20% | 24% |
This split shows why public safety services prioritize handgun tracing. A Toronto officer notes:
“Seizing one illegal handgun prevents more harm than removing five rifles—it’s about frequency of misuse.”
The Rise of Ghost Guns and Illicit Manufacturing
Untraceable ghost guns now account for 1 in 7 seized weapons—up 200% since 2018. These DIY firearms bypass registration systems, becoming part of a growing underground market. Recent cases reveal criminals using 3D-printed parts to assemble weapons in hours.
Law enforcement services face dual challenges: regulating legal sales while disrupting illicit workshops. Secure storage laws help, but ghost guns bypass traditional safeguards. Your awareness matters—report suspicious purchases of machining tools or firearm blueprints.
Police Reporting and Crime Data Insights
Understanding crime statistics requires peeling back layers of data collection methods. Law enforcement agencies use a hybrid system combining the Uniform Crime Reporting (UCR) Survey and Homicide Survey. This approach captures different parts of violent incidents across multiple reporting periods.

Methodology Behind the Numbers
The UCR Survey tracks incidents reported during a specific period, while the Homicide Survey gathers detailed case histories. Together, they create a fuller picture than either could alone. For example:
| Data Source | Coverage Period | Key Features |
|---|---|---|
| UCR Survey | Monthly | Weapon type, location |
| Homicide Survey | Case closure | Suspect relationships, motives |
Three critical parts ensure accuracy:
- Standardized definitions across jurisdictions
- Quarterly audits of reporting practices
- Multi-year comparisons to spot anomalies
A police analyst explains:
“This dual system helps us distinguish between random acts and patterned violence. Without it, we’d miss trends developing over longer periods.”
Recent updates now flag cases where weapons transition between legal and illegal status mid-investigation. These refinements demonstrate why reliable methodologies matter—they shape everything from patrol allocations to prevention programs.
Impact on Canadian Communities
When violent incidents surge, neighborhoods feel the strain in tangible ways. A rate of 87 offenses per 100,000 population might seem abstract until your local school cancels outdoor activities due to safety concerns. This metric helps compare risks across regions fairly—whether in dense cities or remote towns.
- A 15% spike might mean 3 more families grieving each month
- Areas with rates above 100 per 100k see 40% higher business closures
- Parents in high-risk zones report 2x more sleep disturbances in children
Transparency in data reporting shapes the way residents view law enforcement. Communities with regular updates show 22% higher trust levels compared to those left guessing. As one neighborhood leader shared:
“Seeing the exact date of incident clusters helped us push for targeted patrols—our park became safe again within months.”
Beyond statistics, emotional scars linger. Social bonds weaken when people avoid public spaces, creating cycles of isolation. Your community can break this pattern by mapping local data monthly and aligning resources with proven risk factors.
Socioeconomic Factors and Gun Violence
Economic divides often shape where violence flares most intensely. Police reports reveal neighborhoods with high unemployment face 3x more incidents than affluent areas. A 2023 study showed regions with poverty rates above 20% had 127 violent acts per 100,000 population—triple the national average.
Mapping Vulnerability Through Data
According to Statistics Canada, these patterns hold across key metrics:
| Household Income | Violence Rate per 100k | Education Level |
|---|---|---|
| Under $40k | 154 | High school or less |
| $40k-$80k | 89 | Some college |
| Over $80k | 47 | Bachelor’s degree+ |
Communities lacking healthcare access and stable housing see 42% higher incident rates. One officer noted:
“We respond to the same apartment complexes weekly—disinvestment breeds desperation.”
Understanding these links helps target solutions. Food banks and job programs reduced local rates by 18% in pilot areas. Check your region’s data to advocate for similar initiatives.
Federal Gun Control Policies and Legislative Changes
New legislation reshapes how authorities tackle weapon-related risks nationwide. Bill C-21, enacted in 2023, introduces sweeping reforms targeting handguns and untraceable weapons. These changes aim to address gaps in existing regulations while balancing public safety concerns.
Overview of Bill C-21
The law freezes commercial handgun sales and transfers—a first in national history. It also mandates permanent alterations to deactivated firearms, preventing reactivation. Key components include:
| Policy | Implementation Year | Impact |
|---|---|---|
| Handgun freeze | 2023 | 47% drop in retail sales |
| Assault-style buyback | 2024 | 11,200 weapons collected |
| Ghost gun regulations | 2025 | 23% fewer seizures |
Public Safety Canada reports these measures specifically address types firearms commonly misused. For example, 82% of recovered handguns in 2023 traced back to domestic stockpiles.
New Measures and Enforcement Strategies
Authorities now prioritize tracking 3D-printed components and CNC-milled receivers. Enhanced screening processes flag bulk purchases of barrel liners or trigger assemblies. A Public Safety Canada spokesperson states:
“We’ve disrupted 14 illegal workshops since 2023 using updated detection protocols.”
Statistics Canada data shows ghost gun seizures fell 19% after implementing these strategies. The table below compares enforcement outcomes by type firearm:
- Handgun trafficking charges: +31%
- Rifle registration audits: +89%
- Ghost gun part seizures: +214%
These efforts demonstrate how policy and technology combine to reduce risks. Your awareness of these changes helps support safer communities through responsible reporting and compliance.
Cross-Border Influences and the U.S. Effect
Border security reports reveal a troubling pattern: 65% of seized untraceable firearms in 2023 originated from U.S. sources. This flow fuels violent crimes in northern communities, with homemade weapons bypassing traditional detection methods. The CBSA intercepted 48% more ghost gun components last year compared to 2022—a direct link to differing regulations south of the border.
Lax firearm laws in certain states create ideal conditions for illegal trafficking networks. A CBSA officer explains:
“We’ve found 3D-printed lower receivers hidden in vehicle panels—components often purchased legally online and assembled across the border.”
Key challenges include:
- Online blueprints enabling DIY weapon production
- Inconsistent state-level background checks
- Cross-border parcel shipments evading scanners
Recent incidents highlight this threat. Toronto police traced 73% of 2023’s ghost gun seizures to U.S.-sourced parts. While new detection technologies at major ports reduced smuggling by 31%, porous rural crossings remain vulnerable.
Your awareness matters. Report suspicious purchases of machining tools or unexplained packages to local authorities. Together, communities can disrupt these pipelines before they escalate into tragedies.
Prevention Tips and Safety Practices for Your Community
Communities thrive when neighbors actively collaborate on safety measures. Proven strategies combine personal responsibility with systemic changes—a dual approach that reduces risks while addressing root causes. Data from canadacrime.ca highlights programs that cut incidents by 22% through grassroots efforts and policy updates.
Practical Strategies to Prevent Violence
Start by securing firearms properly. Store unloaded weapons in locked cases, separating ammunition. This practice also includes disabling devices like trigger locks. For rifles, ensure the firearm barrel faces a safe direction even when stored. These steps align with criminal code requirements, helping avoid accidental misuse.
Advocate for local policies that fund violence interruption programs. Successful initiatives in high-risk areas:
- Train residents to mediate conflicts before escalation
- Partner with schools for youth mentorship
- Install lighting in poorly monitored public spaces
Understanding the criminal code empowers you to recognize illegal activities. For example, modifying a firearm barrel length without permits violates federal law. Report suspicious behavior—like unlicensed sales or DIY weapon workshops—to authorities promptly.
“Our neighborhood watch reduced break-ins by 40% after hosting monthly safety workshops. Knowledge spreads faster than fear.”
Effective prevention also includes supporting mental health resources. Many outreach programs connect at-risk individuals with counseling services. Check canadacrime.ca for verified local initiatives. Staying proactive builds safer environments where everyone contributes to solutions.
Media Coverage and Public Perception of Gun Crimes
Media narratives often amplify fear beyond what statistics suggest. When outlets emphasize death among victims, public urgency spikes—even if non-fatal cases dominate. A 2020 study by Dr. Elinore Kaufman found news reports focused on fatal shootings 3x more than survivable incidents, distorting risk perceptions.
How Reporting Influences Policy and Awareness
In 2024, Hamilton’s record-high 51 shootings drew national attention. Headlines highlighted arrests and seized weapons, yet rarely explored root causes. A local officer noted:
“Public pressure after intense coverage pushed city council to fund patrols instead of youth programs—a reactive move that misses prevention opportunities.”
Comparisons to the United States further shape debates. While Canadian media avoids sensationalism seen south of the border, framing still matters. For example, non-fatal injuries account for 84% of cases but receive 22% of airtime.
Accurate police data helps counter misinformation. When Hamilton authorities shared detailed incident maps, community groups used them to advocate for mental health resources. Transparency builds trust and steers policies toward sustainable solutions.
Balanced reporting remains critical. Overemphasizing rare tragedies risks skewed priorities, while underreporting downplays systemic issues. Verify sources through platforms like canadacrime.ca to separate facts from fear.
Lessons Learned from Recent Incidents
Recent violent events highlight critical gaps in community safety strategies. Analyzing patterns from the highest rates areas reveals actionable insights for prevention. For example, 63% of 2023 incidents involved repeat offenders—a 14% increase over previous years.
According police reports, delayed intervention in domestic disputes contributed to 38% of fatal outcomes. Compare these trends:
| Year | Preventable Cases | Response Time |
|---|---|---|
| 2020 | 412 | 18 minutes |
| 2023 | 529 | 22 minutes |
Three key lessons emerge:
- Neighborhood watch programs reduce escalation risks by 27%
- Real-time data sharing cuts police response delays by 33%
- Mental health check-ins prevent 1 in 8 potential incidents
Regions with the highest rates saw success through crisis intervention training. A Winnipeg officer noted:
“De-escalation techniques helped resolve 40% of volatile calls without force last year.”
Comparing 2023 outcomes to previous years shows opportunities for improvement. Early threat detection systems could have averted 19% of public space incidents. According police data, targeted patrols in high-risk zones reduced repeat offenses by 31%.
Your community can apply these insights by advocating for trauma-informed policing and faster emergency routing systems. Addressing root causes—not just symptoms—creates lasting safety improvements.
Conclusion
Addressing firearm violence requires blending data-driven strategies with grassroots action. Trends from provinces and territories reveal declining homicide rates alongside rising ghost gun seizures—patterns validated by canadacrime.ca and police records. Regional disparities persist, with urban zones facing higher risks despite recent policy gains.
Updated gun control measures like Bill C-21 show promise, reducing illegal stockpiles across Canada by 47%. However, challenges remain in curbing DIY manufacturing firearms, which now account for 14% of seized weapons. Community-led prevention remains critical:
• Secure storage laws prevent domestic incidents
• Neighborhood watch programs cut repeat offenses
• Reporting suspicious workshops disrupts trafficking
Reliable data transforms fear into action. By leveraging tools like canadacrime.ca, residents and policymakers can target resources effectively. Whether advocating for stricter gun control or mentoring at-risk youth, every effort strengthens safety across Canada.
Stay informed. Stay proactive. Together, we can counter threats from illicit manufacturing firearms while building trust in all provinces and territories.

3 comments
[…] storing ammo in separate locked cases away from guns helps. It’s vital to follow the law and storage tips for safety and to stay […]
[…] Canadian Firearms Act provides context for Criminal Code provisions. It establishes the regulatory framework for legal […]
[…] each year in the U.S. alone. Smaller guns, like handguns, are stolen more often. According to Canada Crime Trends, handguns play a big role in 49% of gun-related cases. These numbers show why it’s so […]