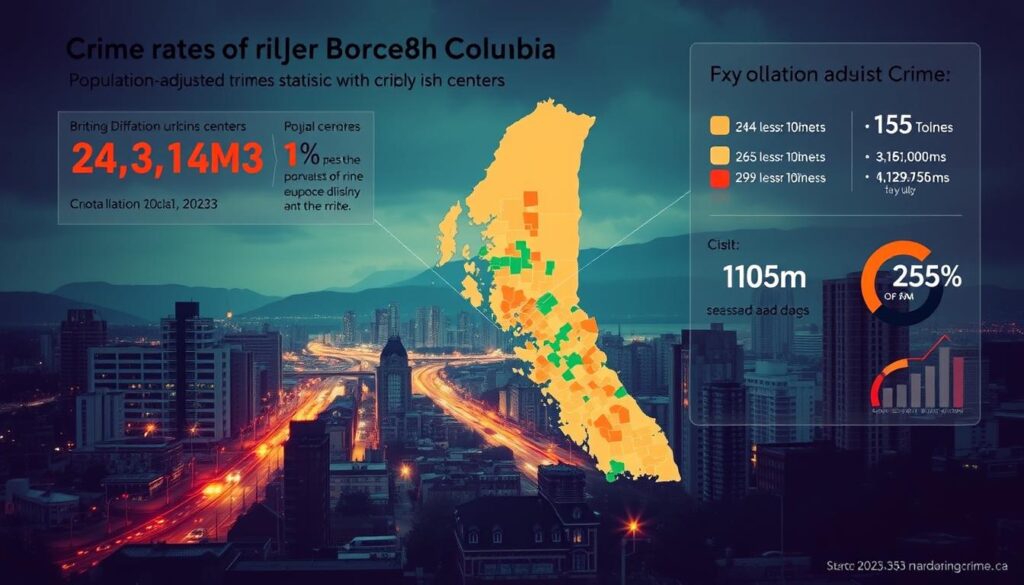
Canada’s crime landscape is a complex issue, with crime rates varying significantly across different regions. Recent crime statistics reveal that British Columbia is no exception, with certain cities experiencing higher incidences of criminal activity than others.
To understand the scope of this issue, it’s essential to examine the crime data collected by police agencies throughout the province. By analyzing these statistics, we can gain valuable insights into regional safety trends and identify areas that require increased attention and resource allocation.
The analysis of crime rates in B.C. cities will provide a comprehensive understanding of the current state of public safety, enabling communities and policymakers to make informed decisions about safety measures.
Understanding Crime Statistics in British Columbia
To comprehend the crime landscape in British Columbia, it’s essential to understand the mechanisms behind crime data collection and reporting. The province employs a standardized system for gathering and analyzing crime statistics, which is crucial for assessing public safety.
How Crime Data is Collected in B.C.
British Columbia uses the Police Records Information Management Environment (PRIME) to collect crime data, ensuring consistency across jurisdictions. This data is then compiled by Statistics Canada through the Uniform Crime Reporting (UCR) survey. The process involves multiple quality control measures to ensure accuracy, though statistics may be revised as investigations progress.

The Crime Severity Index Explained
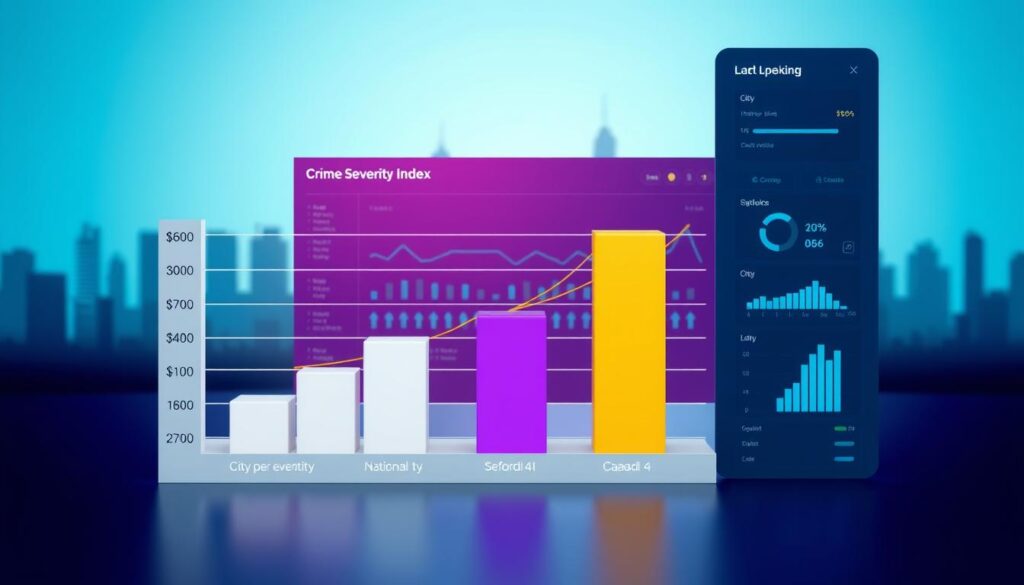
The Crime Severity Index (CSI) is a comprehensive measure that weights offenses based on their seriousness, as determined by court sentencing patterns. This index provides a more nuanced view of public safety by assigning higher weights to serious crimes like homicide and lower weights to less severe offenses. The CSI is calculated using data from Statistics Canada’s Table 35-10-0063-01.
| Crime Type | Weightage | Example |
|---|---|---|
| Violent Crime | High | Homicide |
| Property Crime | Low to Medium | Theft |
B.C. Crime Rates by City: Major Urban Centers
British Columbia’s major urban centers exhibit diverse crime patterns, reflecting the complexity of policing in the region. Understanding these patterns is crucial for developing effective crime prevention strategies.
Metro Vancouver Crime Statistics
Metro Vancouver, the province’s largest urban area, shows distinct crime patterns with variations between its core city and surrounding municipalities. The crime severity index for Metro Vancouver was 79.3, a decrease of 7.4%, while the crime rate was 90.2 per 1,000 population, a decrease of 2.4%. However, Vancouver city had a crime severity index of 102.8 and a crime rate of 97.0 per 1,000 population, with a 5.6% increase in overall crime rate.
The disparity between the crime severity index and the overall crime rate in Vancouver city highlights the importance of examining both metrics when assessing public safety. This discrepancy suggests that while the overall number of crimes may be increasing, the severity of those crimes may be decreasing, or vice versa.

Victoria and Vancouver Island Crime Rates
Victoria and surrounding Vancouver Island communities present a unique crime profile. The Greater Victoria area showed a significant 18.4% decrease in crime severity despite a 6.8% increase in the overall crime rate. The crime severity index for Greater Victoria was 74.1, and the crime rate was 79.9 per 1,000 population.
This contrasting trend between crime severity and overall crime rate in Greater Victoria underscores the complexity of crime patterns in the region. It suggests that while the number of crimes may be rising, the seriousness of those crimes is decreasing.
| City | Crime Severity Index | Crime Rate per 1,000 Population | Change in Crime Severity Index | Change in Crime Rate |
|---|---|---|---|---|
| Metro Vancouver | 79.3 | 90.2 | -7.4% | -2.4% |
| Vancouver City | 102.8 | 97.0 | -2.8% | +5.6% |
| Greater Victoria | 74.1 | 79.9 | -18.4% | +6.8% |
Interior B.C. Cities: Kelowna, Kamloops, and Prince George
Interior B.C. cities generally experience higher crime rates than coastal urban centers. Kelowna, a major tourism destination, faces distinct seasonal fluctuations in criminal activity, with a crime rate of 137.6 per 1,000 population, a 7.3% decrease from the previous reporting period.
Kamloops has seen an 8.2% increase in its crime rate, reaching 172.0 incidents per 1,000 population. Prince George reported the highest crime rate among major B.C. cities at 233.1 incidents per 1,000 population, an 11.1% increase.
The varied crime trends in these interior cities highlight the challenges faced by local law enforcement agencies. Police agencies in each city employ tailored approaches to address their specific crime challenges, with resource allocation often reflecting the unique needs of each community.
Comparing B.C. Cities to National Averages
To contextualize crime in British Columbia, it’s essential to compare B.C. cities with other major urban centers across Canada. This comparison provides a broader understanding of crime trends and helps in evaluating the effectiveness of local crime prevention strategies.
How B.C. Cities Rank Among Canadian Urban Centers
British Columbia’s urban centers generally report higher crime rates compared to the national average, with several B.C. cities ranking among the highest in Canada for both overall crime rates and crime severity. For instance, Vancouver’s crime severity index stands at 102.8, falling between Toronto’s 96.0 and Montreal’s 113.9. This positioning indicates that while Vancouver’s crime severity is lower than Montreal’s, it is higher than Toronto’s. According to Statistics Canada, such comparisons are crucial for understanding the national landscape of crime.
When comparing major Canadian metropolitan areas, the data reveals that some eastern Canadian cities have seen increases in their crime severity indices, while several B.C. communities have experienced decreases. This divergence suggests potentially different regional trends in crime rates.

Year-over-Year Crime Trends in British Columbia
Year-over-year analysis of crime trends in B.C. shows fluctuating patterns across different crime categories. Property crimes and violent offenses have exhibited different trajectories in many communities. For example, while some cities have seen a decrease in certain types of property crime, others have experienced an increase in violent offenses.
The provincial crime rate trends must be examined in the context of policy changes, policing strategies, and socioeconomic factors that vary across different regions of Canada. According to recent data, police-reported crime statistics indicate that B.C.’s position relative to national averages has remained fairly consistent over recent years, though with notable variations at the individual city level.
As crime data continues to evolve, understanding these trends is crucial for developing effective crime prevention initiatives and policing approaches tailored to the specific needs of B.C. cities.
Types of Crime Across British Columbia
British Columbia’s crime landscape is characterized by regional disparities in crime types and severity. The province’s diverse cities exhibit different crime profiles, influenced by factors such as urban density, socioeconomic conditions, and tourism activity.
Violent Crime Statistics by Region
Violent crime statistics vary significantly across British Columbia’s regions. Northern and interior communities generally report higher rates of violent crime compared to coastal urban centers. For instance, Prince George shows the highest violent crime severity index among major B.C. cities at 253.7, representing a 13.3% increase. This highlights the regional disparities in public safety challenges.
The violent crime severity index in Vancouver was 102.8, a decrease of 2.8%, while Victoria recorded a violent crime severity index of 146.2, marking a 9.4% decrease. In contrast, interior cities like Prince George face more significant challenges with violent crime.
| City | Violent Crime Severity Index | Change (%) |
|---|---|---|
| Vancouver | 102.8 | -2.8 |
| Victoria | 146.2 | -9.4 |
| Prince George | 253.7 | +13.3 |
Property Crime Distribution in B.C. Cities
Property crimes constitute the majority of criminal offenses in most B.C. cities. However, the distribution and types of property crimes vary based on urban density, tourism activity, and socioeconomic factors. For example, Victoria’s non-violent crime severity index was 182.5, a significant increase of 19.2%, contrasting with its decreasing violent crime severity.
Police agencies across the province allocate resources differently based on their specific crime profiles. Understanding the distribution of different crime types helps communities develop more effective prevention strategies and allows individuals to take appropriate precautions based on local risk factors.

Conclusion: Understanding and Preventing Crime in B.C.
The analysis of crime rates in B.C. cities reveals a complex picture, highlighting the need for nuanced approaches to crime prevention. Understanding the crime severity index and crime rates is essential for developing effective strategies. Regional variations in crime patterns across B.C. cities necessitate tailored prevention efforts.
By examining crime statistics and year-over-year trends, communities can work with police and government agencies to enhance public safety. It’s crucial to consider differences in reporting methods between police agencies and Statistics Canada data when comparing crime statistics.
Effective prevention requires a deep understanding of the specific crime challenges faced by each city. By leveraging crime data and collaborating with local stakeholders, B.C. communities can develop targeted initiatives to improve safety and reduce crime.

