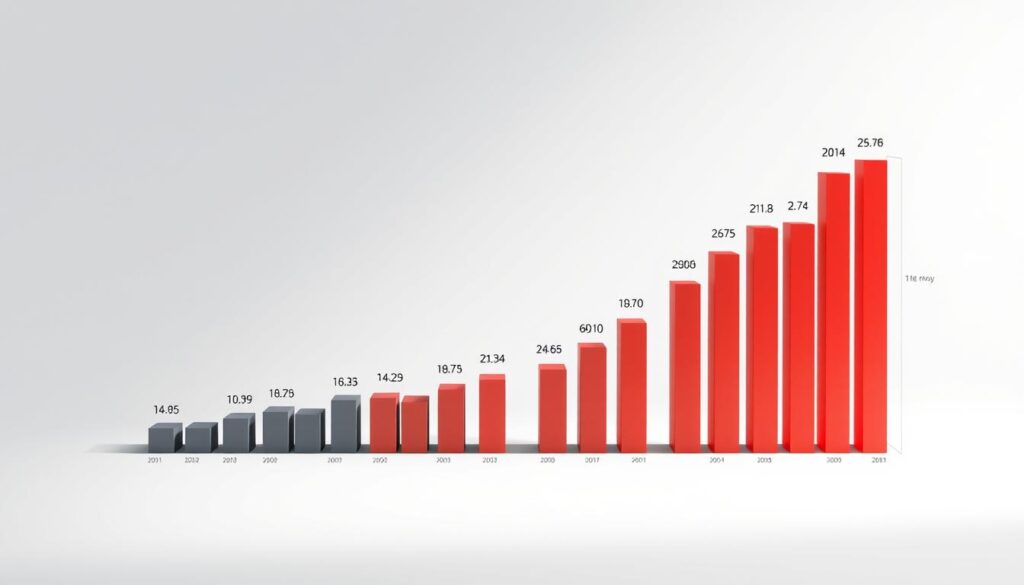
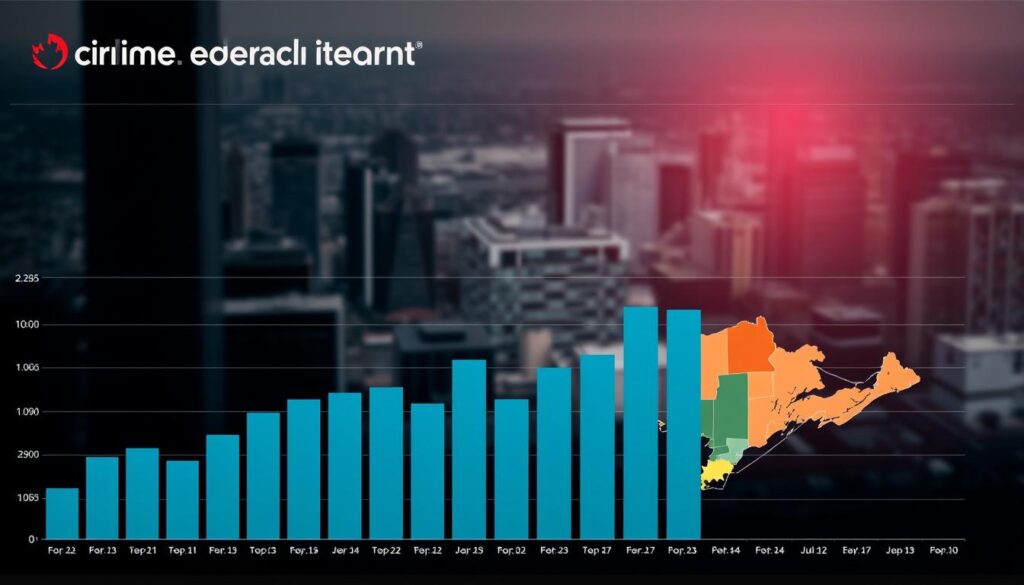
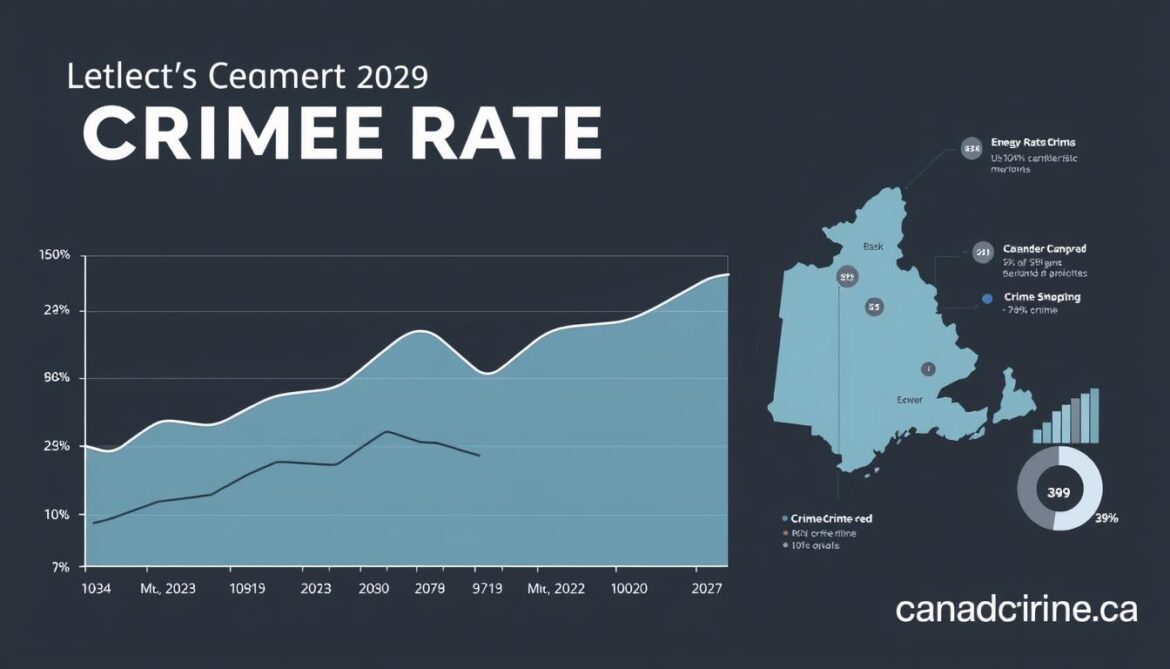
According to recent data from Statistics Canada, the Crime Severity Index (CSI) has shown a notable shift in crime trends across Canada. In 2023, despite an increase in certain crime categories, many metrics remain lower than pre-pandemic levels.
The CSI, which takes into account both the volume and seriousness of crimes, provides a nuanced understanding of crime rate trends. This comprehensive analysis will examine the evolving landscape of crime statistics in Ontario, Canada’s most populous province, over the past two decades.
By analyzing crime data and trends, this report aims to provide insights into the complex reality of crime in Ontario and its relation to national averages.
Current State of Ontario Canada Crime Rate
Recent data indicates a shift in Ontario’s crime trends, with an overall increase in criminal activity from 2022 to 2023. This change is particularly notable in the youth crime rate, which saw a 19% increase during the same period.
Overview of Crime Statistics in Ontario
Ontario’s crime landscape is characterized by a 19% rise in police-reported incidents from 2022 to 2023, making it one of the provinces with significant growth in criminal activity. The crime rate per 100,000 population provides a standardized measure for comparisons across regions and time periods. Statistical analysis reveals that while certain crime categories have increased, the overall crime rate remains lower than pre-pandemic levels, suggesting a normalization rather than a new crime wave.
The youth crime rate, specifically, was 2,898 per 100,000 in 2023, compared to 3,213 per 100,000 in 2019. This indicates that despite recent increases, youth crime rates are still below pre-pandemic levels.

| Year | Youth Crime Rate per 100,000 | Percentage Change |
|---|---|---|
| 2019 | 3,213 | – |
| 2023 | 2,898 | -9.8% |
| 2022-2023 | – | +19% |
Comparison to National Averages
When comparing Ontario’s crime statistics to national averages, the province shows distinct patterns in both violent and property crimes. Ontario’s crime rates are higher than some provinces like Quebec in certain categories but lower than western provinces like Saskatchewan and Manitoba in others.
Internationally, Ontario generally experiences lower rates of violent crime compared to comparable U.S. states. The comparison between Canada and the United States crime metrics highlights significant differences in measurement methodologies and actual crime rates.
- Ontario’s middle-ground position in crime rates among Canadian provinces.
- Lower violent crime rates compared to similar U.S. states.
- Variations in crime patterns between urban and rural areas.
Historical Crime Trends in Ontario
Ontario has witnessed substantial transformations in its crime patterns over the last twenty years, driven by various socioeconomic and demographic factors. Understanding these trends is crucial for developing effective crime prevention strategies and policies.
Long-term Crime Rate Patterns
Between 2003 and 2023, Ontario’s crime rate has shown a general downward trend until recent years. The youth crime rate, for instance, decreased by 70% from 7,280 per 100,000 youth population in 2003 to 2,163 per 100,000 in 2021. This decline coincides with the implementation of the Youth Criminal Justice Act (YCJA) in 2003.
The long-term data indicates that property crimes, including theft and breaking and entering, have followed different trajectories compared to violent crimes. Property crime rates have shown greater sensitivity to economic conditions.

Pre-Pandemic vs. Post-Pandemic Crime Rates
Pre-pandemic crime rates in Ontario established certain baselines that were disrupted during 2020-2021. The pandemic led to a significant decrease in crime rates initially, but subsequent years saw increases in various crime categories. From 2022 to 2023, increases were observed in violent crimes (+10%), property crime (+13%), and other Criminal Code offences (+20%).
For more detailed information on violent crime rates, visit Canada Crime Rate.
Impact of Socioeconomic Factors on Crime Trends
Socioeconomic factors such as unemployment rates, income inequality, and housing affordability have demonstrated correlations with specific types of property crimes and violent crimes across different regions of Ontario. Economic downturns, including the 2008 financial crisis and the COVID-19 pandemic, have historically corresponded with increases in certain categories of property crimes.
| Crime Category | Pre-Pandemic Rate (2019) | Post-Pandemic Rate (2023) | Percentage Change |
|---|---|---|---|
| Violent Crimes | X per 100,000 | Y per 100,000 | +10% |
| Property Crimes | A per 100,000 | B per 100,000 | +13% |
| Other Criminal Code Offences | M per 100,000 | N per 100,000 | +20% |
Crime Severity Index Analysis
The Crime Severity Index (CSI) is a sophisticated metric that goes beyond mere crime counts to assess the severity of crimes in Ontario, Canada. This index is crucial for understanding the complexity of crime trends, as it takes into account both the volume and the seriousness of criminal offenses.
Understanding the Crime Severity Index Methodology
The CSI is calculated based on the average sentences handed down by criminal courts for various offenses, assigning a weight to each crime accordingly. The more serious the average sentence, the higher the weight for that offense. This methodology ensures that more serious crimes have a greater impact on the index. All police-reported Criminal Code offenses, including traffic offenses and other federal statute offenses, are included in the CSI.

Violent Crime Severity in Ontario
Violent crimes, such as homicide, have a significant impact on the Crime Severity Index due to their seriousness and the severe sentences associated with them. In Ontario, the Violent Crime Severity has shown distinct patterns, with certain categories of violent crimes contributing disproportionately to the overall severity score. For instance, homicide receives the highest severity weighting, significantly influencing the index.
Non-Violent Crime Severity Trends
Non-violent crimes, including property crimes like theft, fraud, and breaking and entering, also contribute to Ontario’s overall crime severity. Although these crimes carry lower severity weights compared to violent crimes, their higher frequency can significantly impact the CSI. The data from Statistics Canada indicates that increases in motor vehicle theft, fraud, and breaking and entering have driven the Youth Non-Violent CSI upwards.
| Crime Category | 2022 | 2023 | Change (%) |
|---|---|---|---|
| Motor Vehicle Theft | 20.5 | 26.7 | +30% |
| Fraud | 15.2 | 17.6 | +16% |
| Breaking and Entering | 10.8 | 11.7 | +8% |
The Crime Severity Index provides a nuanced understanding of crime trends in Ontario, highlighting the importance of considering both the volume and severity of crimes. By analyzing the CSI, law enforcement and policymakers can prioritize resources more effectively, focusing on the crimes that have the most significant impact on public safety and the justice system.
Youth Crime in Ontario’s Criminal Landscape
Understanding youth crime in Ontario necessitates examining the statistical trends, types of offenses, and the legal framework governing it. Youth crime represents a distinct and important segment of Ontario’s criminal landscape, with unique patterns, causes, and approaches to prevention and rehabilitation that differ from adult criminal justice.

Youth Crime Rate Statistics and Trends
From 2022 to 2023, the youth crime rate in Ontario increased by 13%, rising from 2,571 per 100,000 youth population to 2,898 per 100,000. This follows a 19% increase in 2022, marking the second consecutive year of rising youth crime rates after nearly two decades of decline. The long-term decrease in youth crime rates, which began with the implementation of the Youth Criminal Justice Act in 2003, saw rates drop from 7,280 per 100,000 in 2003 to 2,163 per 100,000 in 2021, representing a 70% decrease.
- Recent statistics show a concerning trend of increasing youth crime rates in Ontario.
- The rate of youth crime varies across different provinces, with Prince Edward Island experiencing the most dramatic increase.
- Understanding these trends requires examining both the number of incidents and population demographics.
Types of Youth Offenses in Ontario
Police-reported youth crime data reveals that young offenders in Ontario are involved in various criminal activities, including property crimes like theft and violent offenses. The types of youth offenses show distinct patterns, with property crimes representing a significant portion of youth criminal activity.
From 2022 to 2023, increases were observed in most offense categories, including violent crimes (+10%), property crime (+13%), and other Criminal Code offenses (+20%). These trends highlight the need for targeted prevention and intervention strategies.
The Youth Criminal Justice Act and Its Effects
The Youth Criminal Justice Act, implemented in 2003, fundamentally changed how the justice system approaches young offenders, emphasizing rehabilitation and reintegration rather than punishment. This shift contributed to the long-term decline in youth crime rates until recent years.
Police utilize various approaches when dealing with youth offenders, including extrajudicial measures that divert young people from formal criminal charges when appropriate. This reflects the rehabilitative philosophy of the youth justice system, aiming to prevent further criminal involvement among youth.
Conclusion: Future Outlook and Crime Prevention Strategies
The complex picture of Ontario’s crime rate trends necessitates a nuanced approach to crime prevention, addressing both the volume and severity of crimes. Effective crime prevention strategies must be data-driven, utilizing statistics from police reports and crime severity index measurements to identify priority areas.
Future crime trends in Ontario will likely be influenced by multiple factors, including demographic shifts, economic conditions, and technological changes. The crime severity index will remain a crucial tool for measuring the effectiveness of prevention strategies, allowing authorities to track whether the most serious crimes are being effectively addressed.
Ontario’s approach to reducing violent crime rates, particularly homicides and serious assaults, requires targeted interventions that address root causes while ensuring appropriate consequences for offenders. In contrast, property crime prevention presents different challenges, requiring strategies that address opportunity reduction, community vigilance, and economic factors.
By adopting evidence-based approaches to crime prevention, balancing enforcement with community engagement and rehabilitation programs, Ontario can effectively reduce crime rates. Ongoing data collection and analysis by Statistics Canada will be essential for tracking emerging crime trends and evaluating the effectiveness of prevention strategies.

