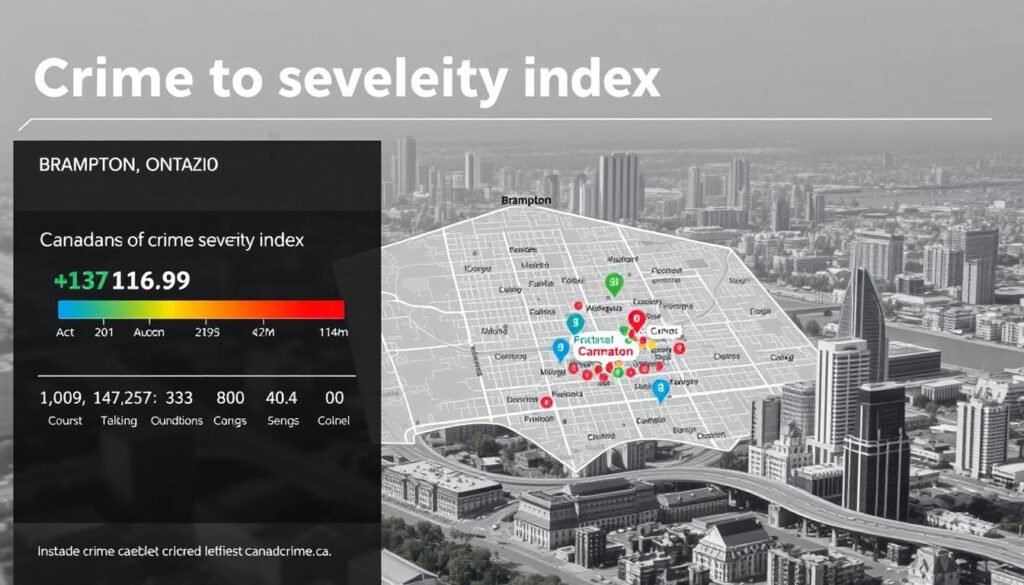
Canada’s crime landscape is a complex issue, with various factors contributing to the overall safety of its cities. A notable statistic reveals that Brampton’s total crime rate stands at 2,958 incidents per 100,000 people, approximately 30% lower than the national average of 4,223.
This data provides valuable insight into the broader landscape of crime across Canada, offering both residents and researchers important context about public safety in this growing municipality. Understanding crime statistics requires examining multiple factors, including the Crime Severity Index, which weighs offenses based on their seriousness.
By analyzing the crime severity index and other relevant data, we can gain a more nuanced understanding of the city’s safety profile and its position relative to national averages.
Understanding Brampton Ontario Crime Rate
To grasp the crime situation in Brampton, Ontario, it’s essential to examine the latest crime statistics. Brampton’s crime landscape is characterized by its violent and property crime rates, which are crucial indicators of public safety.
Current Crime Statistics in Brampton
Brampton’s violent crime rate is estimated at 759 per 100,000 people, which is 27% lower than the national average. Property crime is estimated at 2,199 per 100,000 people. These statistics reveal a nuanced picture of public safety, with the city experiencing notably lower rates of both violent and property crimes compared to national averages across Canada.
- Violent offenses occur at a rate approximately 27% below the national average.
- Property crimes, while more common, remain below national averages.

Crime Severity Index Explained
The Crime Severity Index serves as a crucial metric developed by Statistics Canada that assigns different weights to offenses based on their seriousness. This index provides a more comprehensive understanding than simple crime counts by giving more weight to severe crimes like robberies, assault, and homicides.
- The Crime Severity Index helps communities understand which types of crimes have the most significant impact on public safety.
- It allows for more targeted prevention and enforcement approaches.
Understanding these statistics requires recognizing the methodology behind their collection, including how clearance rates are calculated and how different offense categories contribute to the overall crime severity index measurements.
Comparing Brampton’s Crime Data to National Averages
To assess Brampton’s safety, we need to look at how its crime rates stack up against the national averages.
Brampton’s crime statistics are notably lower than the national averages in Canada. With a total crime rate of 2,958 incidents per 100,000 people, Brampton is significantly safer compared to the national average of 4,223 incidents per 100,000 people. For more detailed crime data, you can visit AreaVibes.
Violent Crime Comparison
Violent crime in Brampton is estimated at 759 per 100,000 people, which is lower than the national average of 1,042 per 100,000 people. This indicates that residents of Brampton face a reduced risk of becoming victims of serious offenses. The data suggests a 1 in 132 chance of being a victim of violent crime, which is more favorable compared to many other Canadian cities.

Property Crime Analysis
Property crime rates in Brampton also show a positive trend, with an estimated 2,199 incidents per 100,000 people, compared to the national average of 3,181 per 100,000 people. This represents a 31% lower rate than the national average, suggesting effective community policing and prevention strategies in place.
Overall Safety Ranking in Canada
When ranked among other major Canadian cities by population size, Brampton consistently performs well in safety metrics. It outperforms larger urban centers like Winnipeg and Vancouver by considerable margins. The year-over-year data suggests stable or improving conditions in most crime categories, placing Brampton among the more secure large municipalities in Canada.
Detailed Crime Information and Trends
To grasp the reality of crime in Brampton, it’s essential to delve into the specifics of crime trends and community concerns. The types of criminal offenses in Brampton follow patterns typical of suburban communities.
Types of Criminal Offenses in Brampton
Property crimes constitute the majority of incidents reported to the police, including theft, vandalism, and break-and-enter offenses. Drug-related crimes are also a significant concern, with 66.48% of people perceiving drug use and dealing as problematic.

Year-over-Year Crime Trends
According to perception data, 75.39% of respondents believe crime is increasing in Brampton over the past 5 years. Year-over-year crime trends provide important context for understanding Brampton’s evolving safety landscape.
Crime Distribution by Neighborhood
The distribution of criminal activity varies significantly across Brampton’s diverse neighborhoods. Some areas experience higher rates of specific offenses, while others maintain consistently lower crime levels. The community perception of safety varies, with 63.10% feeling safe during the day but only 35.71% at night.
| Crime Type | Percentage of Respondents Concerned |
|---|---|
| Property Crimes | 58.10% |
| Violent Crimes | 56.30% |
| Drug-related Crimes | 66.48% |
Understanding these detailed crime patterns allows for more effective prevention strategies tailored to specific neighborhoods and offense types, rather than applying one-size-fits-all approaches across the entire city.
Preventing Crime in Brampton and Across Canada
Effective crime prevention in Brampton demands a holistic approach that addresses the root causes of criminal behavior and fosters a collaborative environment between law enforcement and the community.
A multi-faceted strategy is essential, combining community engagement, strategic police deployment, and evidence-based interventions targeting the specific factors driving local crime rates.
The Crime Severity Index serves as a crucial tool for measuring the effectiveness of prevention efforts over time. By tracking changes in the crime severity and severity index, authorities can evaluate the success of targeted initiatives in reducing serious offenses.
Community-based prevention programs have shown promise in addressing the root causes of criminal behavior. Successful models from other Canadian cities offer valuable templates that could be adapted to Brampton’s specific needs. For more information on Canada’s crime rates, visit our detailed analysis.
Year-over-year tracking of both crime rates and the Crime Severity Index allows for the identification of emerging trends and the evaluation of prevention program effectiveness. Neighboring municipalities with lower crime rates, such as Caledon and Mississauga, offer potential case studies for successful prevention strategies.

