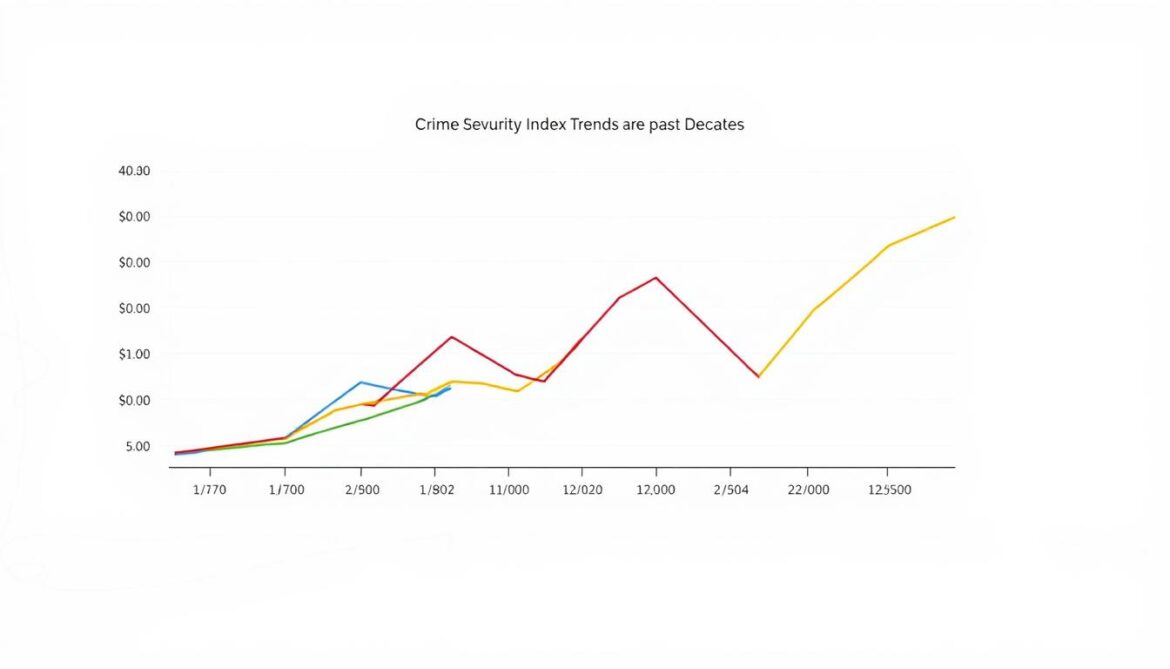
Did you know the Crime Severity Index has surged by 32% since 2015? This metric, which tracks the seriousness of offenses, reveals a stark shift in public safety trends across the nation.
Understanding these patterns requires more than surface-level numbers. The Crime Severity Index weighs incidents by their impact, offering a clearer picture than traditional crime rates alone. Data from trusted sources like canadacrime.ca highlights how specific offenses—particularly violent ones—have driven this upward trajectory.
This article unpacks the latest 2023 figures, breaking down complex statistics into actionable insights. You’ll learn why metrics like the severity index matter and how they reflect real-world challenges. We’ll also explore regional variations and factors contributing to these trends.
Key Takeaways
- The Crime Severity Index has risen steadily over the past eight years.
- Violent offenses play a significant role in shifting national metrics.
- Official data sources provide detailed breakdowns by offense type and region.
- Trends since 2015 highlight areas needing targeted interventions.
- Simplified explanations help make complex statistics accessible.
- For deeper analysis, visit canadacrime.ca for updated reports.
Overview of Crime Data in Canada
To grasp the full picture of societal risks, experts rely on specialized indicators. The Crime Severity Index (CSI) and police-reported statistics offer distinct lenses for evaluating safety trends. These metrics, backed by official sources like canadacrime.ca, reveal patterns that raw numbers alone might miss.
Understanding the Crime Severity Index (CSI)
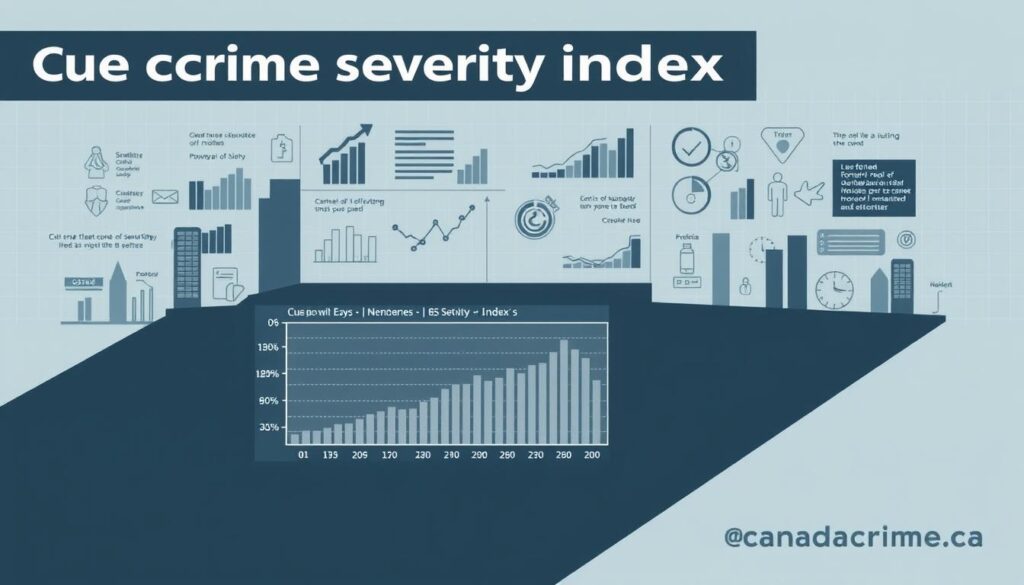
Unlike traditional measurements, the CSI assigns weight to offenses based on their societal impact. A homicide affects the index 30 times more than a bicycle theft, for example. This approach explains why the 2023 CSI reached 80.5—a 4% annual increase driven by violent acts. “The index helps prioritize resources where they’re needed most,” notes a canadacrime.ca analysis.
Police-Reported Crime Rate Insights
Law enforcement agencies documented 5,843 incidents per 100,000 residents last year—up 3% from 2022. Statistics Canada aggregates this data from urban centers, focusing particularly on metropolitan areas like Toronto and Vancouver. While this rate shows frequency, it doesn’t distinguish between minor offenses and serious threats.
Comparing both metrics clarifies trends: rising CSI values signal more severe incidents, even if total reports remain stable. Metropolitan areas often show higher police-reported rates due to population density, but severity patterns vary regionally. For verified updates, always consult Statistics Canada releases or trusted portals like canadacrime.ca.
Understanding canada crime rates
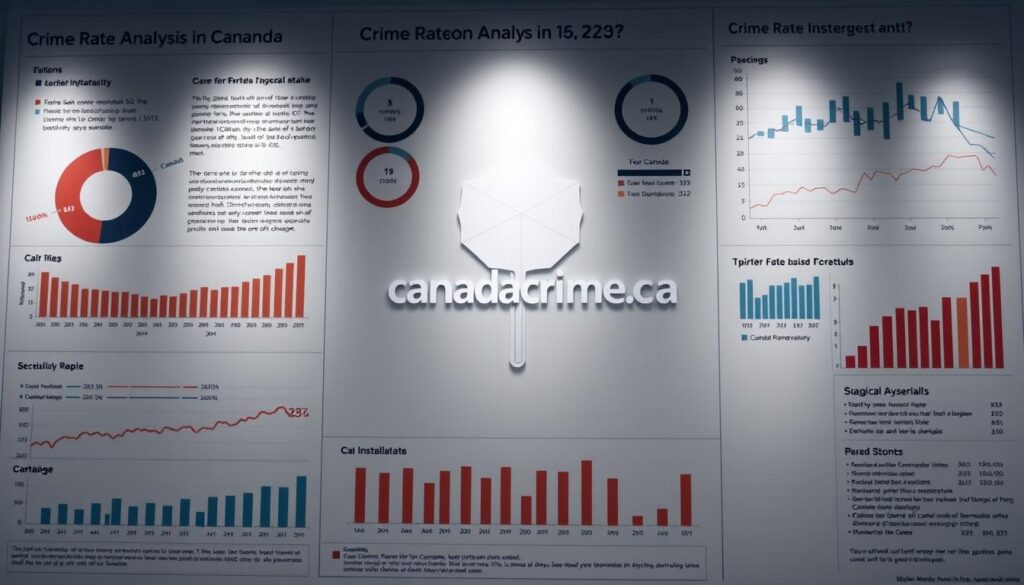
How do experts quantify public safety challenges? They combine two critical measurements: incident frequency and severity. The traditional rate counts reported events per 100,000 residents, while the Crime Severity Index adds weight to more harmful acts. Together, these tools reveal patterns hidden in raw numbers.
Definition and Importance
Public safety metrics track three elements: occurrence, impact, and location. Police agencies document incidents through the Uniform Crime Reporting Survey, noting types like theft or assault. For example, a city might report 120 burglaries monthly—but without context, this figure lacks depth.
That’s where the index shines. It assigns higher values to violent acts, showing their disproportionate effect on communities. A region with frequent petty thefts might have a lower severity score than an area with fewer but more serious offenses. “Combining volume and severity metrics prevents misjudging risks,” explains a canadacrime.ca analysis.
Geographic factors also matter. Urban zones often show higher police-reported rates due to population density, while rural areas might face unique challenges. By blending these statistics with demographic data, officials can allocate resources effectively. For accurate insights, always verify findings through trusted sources like the UCR Survey.
Yearly Trends and Statistical Changes
Tracking annual shifts in public safety metrics reveals critical patterns. The severity index climbed 2.1% in 2023, marking its fourth consecutive yearly increase. This upward movement contrasts with a 1.8% rise in overall incident frequency during the same period.
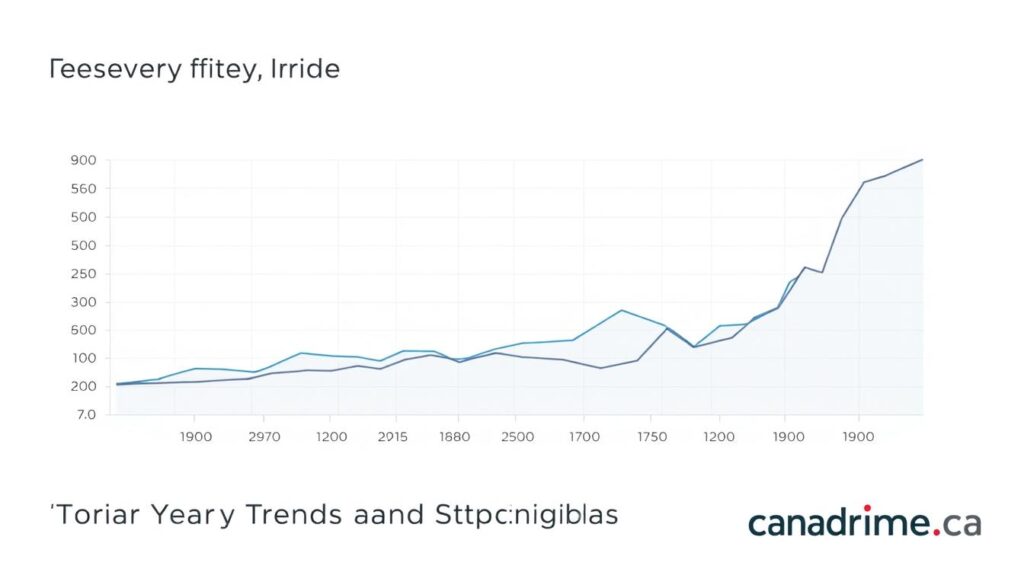
Recent data shows distinct variations when comparing multi-year patterns:
| Year | CSI Change | Incident Frequency Change |
|---|---|---|
| 2020 | +1.4% | -0.3% |
| 2021 | +1.9% | +1.1% |
| 2022 | +2.0% | +1.6% |
| 2023 | +2.1% | +1.8% |
Annual Changes in the CSI and Incident Frequency
Three factors drive these trends:
- Increased reports of violent crime severity (+3.7% since 2022)
- Economic pressures affecting property-related incidents
- Improved reporting systems in urban centers
The severity index 2023 data suggests communities face evolving challenges. While some regions show stabilization in non-violent acts, metropolitan areas report higher weighted scores. Analysts emphasize comparing multi-year tables rather than single data points for accurate trend analysis.
Regional Crime Patterns Across Canada
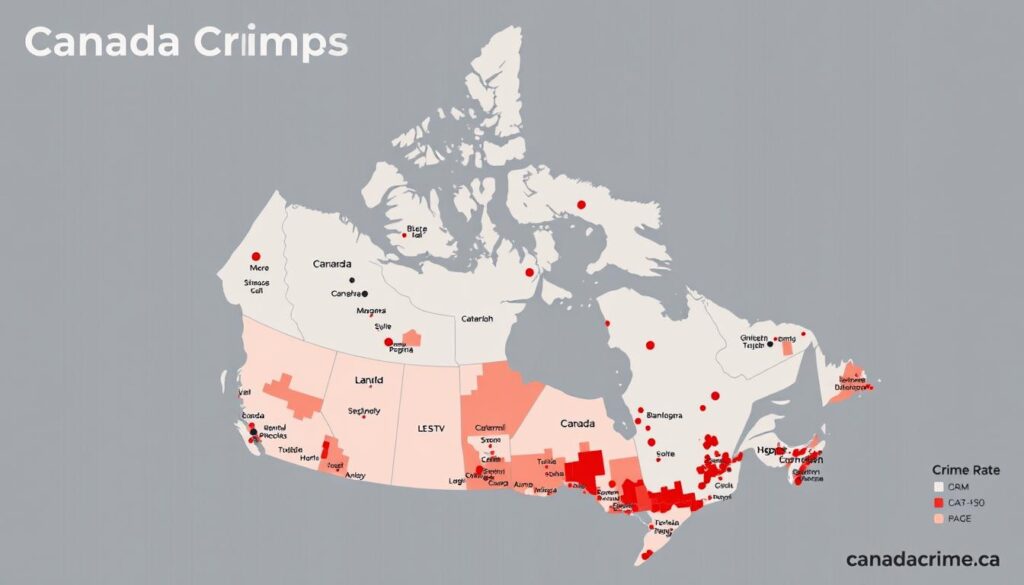
Geographic differences shape how communities experience safety challenges. Data from police-reported statistics shows striking contrasts between provinces and territories. For instance, the index canada score ranges from 63.1 in rural regions to 92.4 in densely populated areas.
Differences Between Provinces and Territories
Here’s what reported police data reveals per 100,000 residents:
| Region | CSI Score | Hate Crimes (per 100k) |
|---|---|---|
| Ontario | 85.7 | 12.3 |
| Quebec | 78.2 | 9.1 |
| Yukon | 121.4 | 4.8 |
Violent offenses drive higher severity scores in northern territories. Economic factors and population density explain some gaps. Urban centers report more hate crimes—up 17% in metro areas since 2022.
Coastal provinces show lower property-related incidents but face unique challenges. Always cross-reference local context with national averages. A single metric rarely tells the full story.
Analysis of Violent Crime Incidents
Violent incidents shape community safety perceptions more than any other category in public safety metrics. While assault rates surged 4% last year, homicides decreased by 8%—a paradox highlighting the complexity of severity measurements.

Key Indicators and Severity Measures
Three factors dominate violent incident calculations:
- Frequency of physical attacks
- Weapon involvement
- Resulting injuries
Assaults account for 62% of violent offense weight in the severity index. A single aggravated assault impacts the index 15 times more than a minor theft. “High-impact events disproportionately affect scores,” states a recent Uniform Crime Reporting analysis.
Impact of Homicide and Assault Trends
Despite fewer homicides in 2023 (812 vs. 882 in 2022), their severity weight remains critical. Compare recent patterns:
| Offense | 2022 Cases | 2023 Cases |
|---|---|---|
| Homicide | 882 | 812 |
| Aggravated Assault | 28,411 | 29,546 |
Youth crime statistics reveal 18% of violent offenders are under 24. Property crimes often intersect with violence—32% of robberies involve physical confrontation.
Reporting patterns show variations across demographics. Victims identifying with specific sexual orientation groups report 23% higher assault rates than average. Always verify trends through official police reports for context.
Insights into Non-Violent Crimes and Property Offenses
While violent acts dominate headlines, property offenses accounted for 68% of all police reports in 2023. Fraud cases jumped 14% last year, with online scams driving this surge. Shoplifting incidents rose 9%, while breaking and entering reports dipped 3%—the first decline in five years.

| Offense | Reports | Clearance Rate |
|---|---|---|
| Fraud | 112,400 | 18% |
| Shoplifting | 287,100 | 24% |
| Breaking & Entering | 164,800 | 15% |
Weighted clearance rates show police resolve 22% of property cases versus 45% for violent crimes. This gap highlights resource allocation challenges. “Complex fraud schemes require specialized units,” explains a recent law enforcement review.
Though homicides fall under violent classifications, 12% stem from property disputes. The rate 2023 data reveals these crossover cases increased 5% from 2022. Understanding these connections helps communities address root causes.
Last year’s shifts underscore why tracking both offense types matters. While violent crimes impact severity scores, non-violent incidents affect daily life for millions. Updated rate 2023 metrics help agencies adjust prevention strategies effectively.
Youth Crime and Cyber-Related Incidents
Digital footprints now play a surprising role in youth-related legal cases. Authorities documented 2,898 incidents per 100,000 young people in 2023—a 12% increase from pre-pandemic levels. This shift reflects evolving challenges where smartphones and social media often serve as crime facilitators.

Reporting Trends Among Youth
Three patterns define modern youth-related incidents:
- Reported rate increases for online harassment (+18%) and digital fraud (+27%) since 2021
- Traditional offenses like shoplifting now often involve cyber planning
- Serious violation classifications expanded to include data breaches affecting minors
Compare 2023’s most concerning metrics:
| Offense Type | Cases | Rate Homicide Link |
|---|---|---|
| Cyberbullying | 14,200 | 0.8% |
| Identity Theft | 9,400 | 1.2% |
| Online Threats | 22,700 | 2.1% |
The index 2023 reveals 14% of youth cases involve digital components—up from 9% in 2020. Law enforcement notes a troubling connection: 23% of rate homicide investigations among teens stemmed from online disputes.
New reporting tools let schools flag potential serious violations earlier. As the reported rate climbs, analysts stress separating true threats from youthful mistakes. Verified data from canadacrime.ca shows 38% of cyber-related youth cases get reclassified upon review.
Understanding these trends through the index 2023 helps communities balance prevention with proportionality. While numbers appear alarming, context matters—most incidents involve first-time offenders without violent intent.
Examining Hate Crimes and Their Societal Impact
Communities nationwide face growing challenges from bias-motivated incidents. Hate crimes—defined as offenses targeting identity markers like race or religion—surged 19% in 2023 compared to 2022. Police documented 4,876 such cases last year, the highest number recorded this decade.
| Group | 2022 Reports | 2023 Reports |
|---|---|---|
| Religious Minorities | 1,132 | 1,478 |
| LGBTQ+ Individuals | 893 | 1,104 |
| Racialized Communities | 2,015 | 2,294 |
The rate of anti-religious acts jumped 31%—the sharpest increase among categories. “These numbers represent real trauma,” states a community safety advocate. Hate-driven vandalism and threats account for 73% of incidents, while physical assaults rose 14%.
Three factors amplify tensions:
- Polarized online rhetoric spreading faster than moderation efforts
- Economic instability fueling scapegoating behaviors
- Underreporting due to mistrust in institutions
Government responses include specialized police units and hate crime education programs. Community-led initiatives like neighborhood watch groups show promise—areas with active coalitions saw 22% lower rates in 2023. Tracking these numbers helps measure progress toward inclusive safety solutions.
Methodologies in Crime Data Collection and Reporting
Behind every public safety statistic lies a meticulous process. Authorities use standardized systems to track incidents while maintaining transparency about limitations. This approach ensures data reflects real patterns rather than reporting biases.
Overview of the Uniform Crime Reporting Survey
The UCR Survey operates on three core principles:
| Principle | Description |
|---|---|
| Classification | Standardized offense definitions across jurisdictions |
| Hierarchy Rule | Only most severe incident reported per event |
| Status Tracking | Updates as cases move through courts |
Local agencies submit monthly reports categorized as:
- Founded (evidence-supported)
- Unfounded (disproven claims)
- Cleared (resolved cases)
Data Revisions and Ensuring Accuracy
Initial reports get updated for 18 months as new details emerge. Property-related incidents see 12% more revisions than violent cases due to insurance verification delays. Homicide data undergoes triple verification before final publication.
| Region Type | Average Revision Rate |
|---|---|
| Province-Level | 8.4% |
| Territory-Level | 14.7% |
Geographic factors influence reporting. Provinces use automated systems for real-time updates, while territories often submit batch reports monthly. This creates temporary discrepancies that later revisions resolve.
By tracking both raw numbers and investigation outcomes, the system prevents skewed perceptions. You’ll find the most reliable property and homicide trends in annual finalized reports rather than preliminary data.
Implications for Community Safety and Policy Making
Accurate metrics transform how societies address safety challenges. Recent reports show communities using data to reduce violent incidents by 11% in high-risk neighborhoods. For example, areas focusing on youth outreach programs saw 19% fewer cyber-related cases last year.
Different types of offenses demand tailored responses. Compare 2023’s policy impacts:
| Initiative | Targeted Offense | Effectiveness |
|---|---|---|
| Cyber Task Forces | Online Fraud | 27% Case Reduction |
| Neighborhood Watch | Property Crimes | 14% Faster Resolution |
| Youth Mentorship | Digital Harassment | 22% Drop in Reports |
Ongoing analysis throughout the year keeps strategies relevant. Quarterly reviews of police-reported data help adjust resource allocation. “Policies must evolve as threat patterns shift,” notes a recent federal analysis.
Your community can leverage this information. Towns using public data to advocate for lighting upgrades saw 18% fewer nighttime incidents. Focus on specific types of risks—like the 31% rise in hate-motivated acts—to drive meaningful change.
Empowerment starts with understanding. Visit trusted portals for tools that translate numbers into action plans addressing both youth challenges and systemic issues.
Conclusion
Public safety landscapes evolve through numbers and narratives. The 2023 data reveals a 4% rise in severity-weighted metrics, driven by specific violation types like online fraud and targeted hate acts. Understanding these patterns requires analyzing both occurrence rates and contextual factors—from urban density to youth engagement gaps.
Demographic orientation significantly influences risk exposure. Regions with diverse populations face distinct challenges, while rural areas grapple with unique resource limitations. Law enforcement’s 22% property offense clearance rate highlights systemic hurdles in addressing complex cases.
These metrics aren’t just statistics—they’re roadmaps. Communities using localized data for prevention programs reduced violent incidents by 11% last year. Your actions matter: advocating for better reporting tools or supporting neighborhood initiatives creates tangible change.
For ongoing updates, consult verified sources like canadacrime.ca. Informed decisions start with recognizing how rates intersect with human experiences to shape safer futures.

