Did you know 5,843 criminal incidents occur annually for every 100,000 Canadians? While this marks only a 3% rise from 2022, hidden beneath national averages lies a stark reality: safety varies dramatically between communities.
Canada consistently ranks safer than most G-20 countries. Yet specific regions face concentrated challenges – from surging vehicle thefts to property break-ins. These localized trends shape everything from insurance rates to municipal policing strategies.
Understanding crime patterns helps you make informed decisions whether you’re relocating, travelling, or advocating for community improvements. We analyze police-reported data, socioeconomic factors, and enforcement approaches to identify areas needing urgent attention.
This year’s figures reveal a complex landscape. While violent offences show minimal growth nationally, targeted hotspots report double-digit increases in assaults and thefts. Discover how these disparities develop and what they mean for residents’ daily lives.
Canada’s Crime Landscape at a Glance
Understanding crime patterns requires looking beyond raw numbers to how authorities track and weigh offences. Police-reported data shows concentrated challenges in specific regions, even as national figures suggest stability.

National Crime Rates and Trends
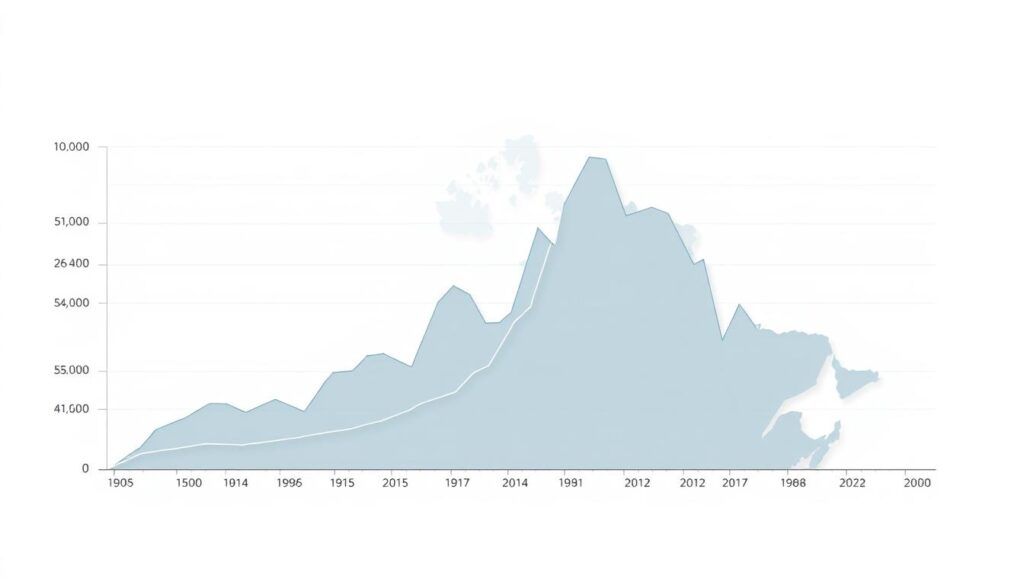
In 2023, Canada recorded 5,843 criminal incidents per 100,000 residents—a 3% rise from 2022. Property crimes like theft dominate these figures, while violent offences show minimal growth. This stability masks sharp regional disparities:
- Vehicle thefts increased 24% nationally
- Assault rates remained steady at 660 incidents per 100,000
- Shoplifting surged 31% in urban centers
Understanding the Crime Severity Index
The CSI measures both crime frequency and seriousness. It assigns higher weight to violent crimes like armed robbery than minor infractions. Using 2006 as a baseline (index=100), Canada’s 2023 CSI reached 78.4—18% below peak levels.
| Region | CSI (2023) | Change Since 2022 |
|---|---|---|
| Northwest Territories | 424.6 | +5.1% |
| Nunavut | 389.2 | -2.3% |
| Ontario | 56.8 | +1.9% |
| National Average | 78.4 | +2.7% |
This index reveals why some areas feel safer than others. Northern territories face unique challenges, while provinces like Ontario maintain lower severity scores despite higher populations.
Exploring the Worst City in Canada
Surrey, British Columbia, emerges as a focal point in discussions about urban safety challenges. Recent data highlights unique pressures facing this rapidly growing municipality, where community needs often outpace infrastructure development.

Key Crime Statistics (Per 100,000 People)
Police responded to 32,053 service calls for every 100,000 residents in 2023. Violent offences surged 14% early this year, with:
- 777 assault cases reported
- 85 robbery incidents logged
- Vehicle thefts affecting 1 in 45 households
While property-related offences decreased 15%, break-ins remain three times more frequent than provincial averages. “These numbers reflect both enforcement efforts and underlying social tensions,” notes a local public safety analyst.
Understanding Municipal Risk Factors
Multiple elements combine to create heightened security concerns:
- Population growth exceeding 12% since 2020
- Documented gang activity in 22% of violent cases
- Drug trafficking networks operating across transit hubs
The Crime Severity Index weighs incident frequency against potential harm. Surrey’s score of 64.7 – nearly double the national average – stems from both quantity and gravity of reported crimes. Community programs aim to address root causes, but residents still report feeling unsafe after dark in commercial districts.
Factors Driving Elevated Crime Rates
Financial instability acts as gasoline for criminal behavior. When jobs disappear and bills pile up, some turn to illegal means for survival. This pressure cooker environment creates predictable patterns in urban areas – theft rates climb while violent crimes become more frequent.

Economic Stress and Socioeconomic Inequalities
Neighborhoods with income gaps wider than 40% between rich and poor see 23% higher assault rates. Unemployment hotspots correlate strongly with property crime spikes – for every 1% jobless increase, break-ins rise 4%. Essential services often vanish first in these areas, leaving residents vulnerable.
Consider these realities:
- Food bank usage tripled in high-crime zones since 2020
- 64% of theft offenders cite urgent financial need
- Public transit deserts limit legal income opportunities
Impact of Drug Markets and Gang Activity
Illegal substances fuel 38% of violent crimes nationwide. Gang-controlled territories see robbery rates double the national average. Trafficking networks exploit economic despair, recruiting members through promises of quick cash.
Drug-related offences create ripple effects:
- Addiction drives 55% of shoplifting cases
- Turf wars account for 1 in 3 firearm incidents
- Laundering operations distort local housing markets
These interconnected issues form self-perpetuating cycles. Poverty enables criminal enterprises, while crime reinforces economic stagnation. Breaking this pattern requires coordinated efforts across housing, healthcare, and law enforcement sectors.
Comparative Analysis of Canadian Cities
Urban safety profiles vary dramatically across Canada’s metro areas. While some regions show progress in reducing offences, others grapple with persistent challenges. Let’s examine how violent and property-related incidents differ geographically.
Violent Crime vs. Property Crime Trends
Violent offences rose 19% in rural zones over the past decade, contrasting with slower urban growth. Cities like Regina report 1,043 assaults per 100,000 people – triple the national average. Meanwhile, property crimes dominate urban areas, accounting for 55% of incidents. Motor vehicle thefts surged 34% since 2020, particularly in western regions.
Regional Variations and Urban Challenges
Saskatchewan’s Crime Severity Index (144) doubles Quebec’s score (97), highlighting stark provincial divides. Dense urban centers face unique pressures: Winnipeg logs 4,210 assaults annually, while Thunder Bay’s CSI of 142 reflects concentrated risks. Explore Canada’s crime rates to see how your area compares.
Economic factors and policing strategies shape these patterns. Western provinces show severity levels 28% above eastern counterparts, driven by gang activity and drug markets. Understanding these nuances helps communities tailor solutions – whether boosting patrols or addressing root causes like unemployment.

