Did you know over 70% of urban areas saw shifts in public safety metrics last year? While homicide rates dropped nationally, certain offenses like robbery and extortion quietly reshaped community risk profiles. This section unpacks patterns you might not expect.
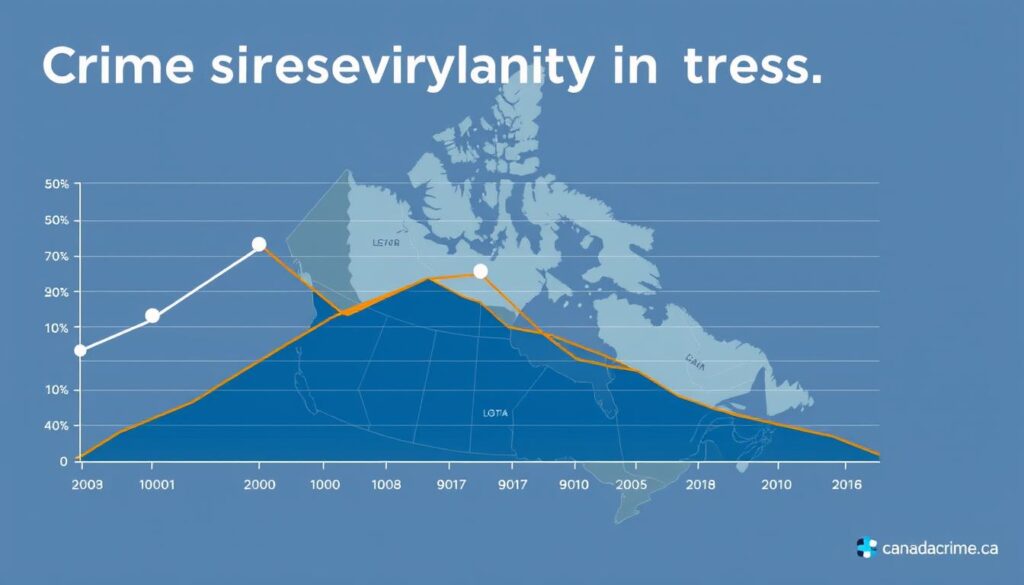
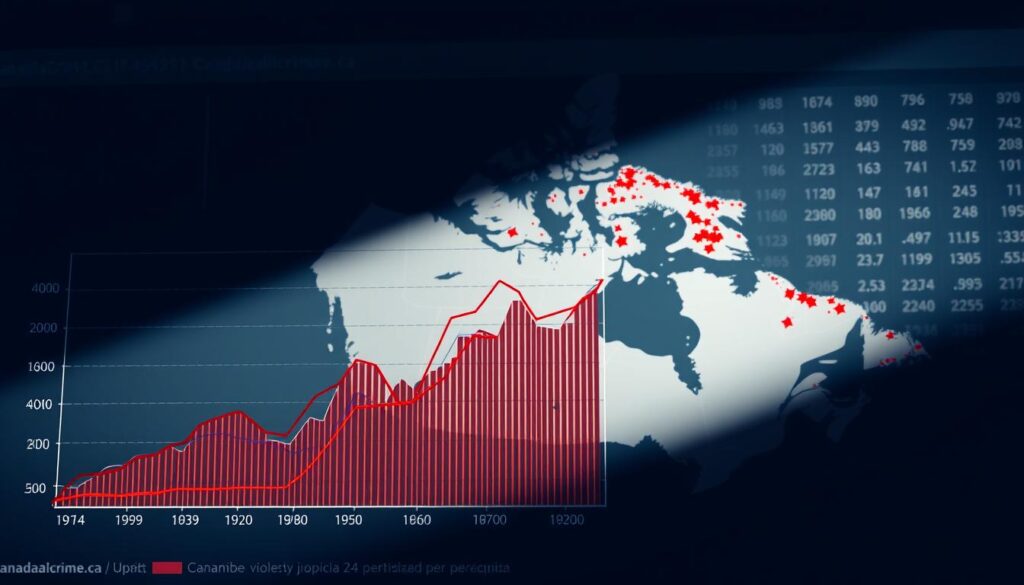
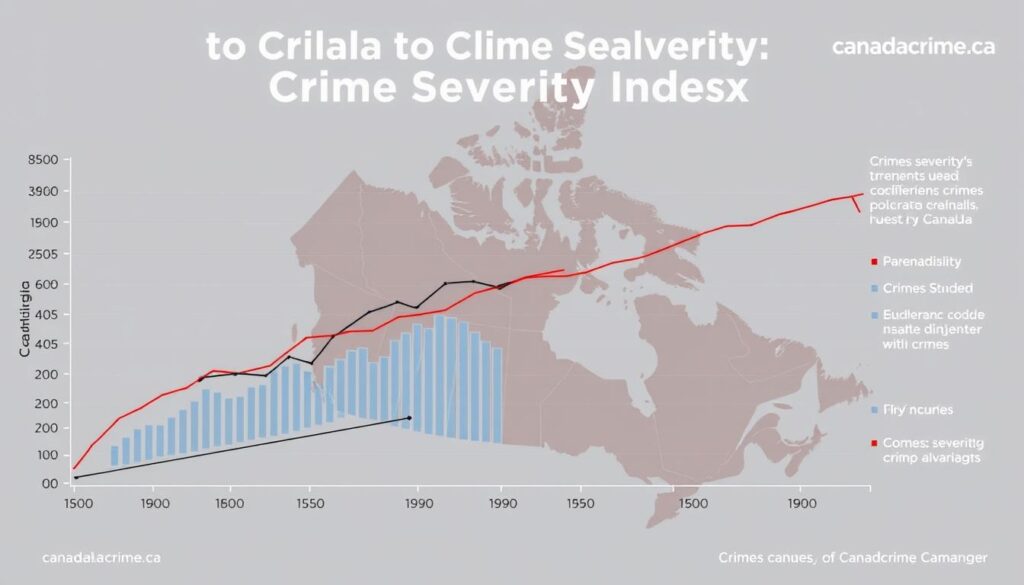
Understanding these numbers requires reliable sources. Platforms like canadacrime.ca simplify access to police-reported data, helping you track trends from the 1990s to today. Authorities use tools like the Crime Severity Index to measure both frequency and impact of incidents.
You’ll see how experts compile information through surveys and local reports. Historical context matters—the past decade shows a 19% climb in overall severity scores despite recent stabilization. These insights shape policies affecting neighborhood safety programs and resource allocation.
Key Takeaways
- Explore current trends through trusted platforms like canadacrime.ca
- Learn how severity indexes track both common and rare offenses
- Discover how data collection methods ensure accuracy
- See connections between historical patterns and modern policies
- Understand why certain crimes impact communities differently
Overview of Crime Trends in Canada
How do experts track shifts in community safety patterns over time? Detailed reporting frameworks reveal hidden dynamics behind headline numbers. The National Justice Statistics Initiative (NJSI) standardizes data collection, ensuring regional comparisons remain meaningful.

Understanding Key Crime Metrics
The Crime Severity Index measures not just how often offenses occur but their societal impact. For example, armed robberies weigh more heavily than minor thefts. Police departments collaborate with the Canadian Centre for Justice and Community Safety Statistics to refine these metrics annually.
This approach helps identify emerging risks. Recent updates show a 7% drop in property-related incidents but a rise in cyber-enabled offenses. You’ll notice trends evolve faster than traditional reporting methods—a gap initiatives like NJSI aim to close.
Historical Shifts and Recent Updates
Over three decades, severity scores fluctuated with economic and social changes. The late 1990s saw higher values due to organized crime spikes, while post-2010 declines reflected targeted policing strategies. Last year’s index highlights unexpected urban-rural divides in incident types.
Local agencies now use granular data to allocate resources where they’re needed most. As one analyst notes, “The index isn’t just numbers—it’s a roadmap for safer neighborhoods.” Your understanding of these patterns empowers better-informed community decisions.
Canada Violent Crime Statistics: Comprehensive Analysis
What do numbers reveal about community safety that raw headlines don’t? Interpreting trends requires tools that adjust for population size and regional differences. Police-reported data standardized to per 100,000 residents removes distortions caused by varying city sizes, letting you compare urban centers and rural towns fairly.

Interpreting the Latest Data
When reviewing reports from Statistics Canada, focus on three elements: incident types, geographic scope, and year-over-year changes. For example, a 12% drop in physical assault rates might seem positive—until you notice a simultaneous 9% rise in threats involving weapons. This nuance explains why severity scores matter more than raw counts.
Calculations per 100,000 people highlight risks accurately. A region reporting 850 incidents might appear safer than one with 1,200—until you account for population density. Always cross-reference totals with this metric to avoid misinterpretation.
Key Factors Behind the Numbers
Economic pressures, social programs, and policing strategies all shape trends. Areas with higher unemployment often see temporary spikes in certain offenses, while community outreach initiatives correlate with long-term reductions. One analyst notes: “Data isn’t destiny—it’s a mirror reflecting systemic strengths and gaps.”
Methodologies matter too. Statistics Canada revises collection practices every five years to capture emerging threats like cyber-enabled crimes. These updates ensure severity indexes stay relevant, helping policymakers allocate resources where they’ll have the deepest impact.
Examining the Crime Severity Index and Regional Variations
Measuring community safety involves more than counting incidents—it requires understanding their impact. The Crime Severity Index assigns weights to offenses based on their societal consequences. More severe acts like armed robberies receive higher values than minor violations. This approach transforms raw numbers into actionable insights.

How the Severity Index is Calculated
Each offense in the index carries a weight reflecting its average sentencing length. Authorities update these values annually using Statistics Canada reports. For example, a homicide might be weighted 10 times higher than shoplifting. This method ensures rare but serious crimes influence overall scores proportionally.
Local agencies combine these weights with occurrence rates. You’ll see higher index values in regions with frequent severe incidents, even if total crimes decrease. One analyst explains: “The system highlights where resources reduce harm most effectively.”
Provincial Differences in Crime Rates
Urban centers often show lower per-capita rates but higher severity scores due to complex offenses. Rural areas might report fewer incidents overall but face unique challenges like limited emergency response times. Recent data reveals a 23% severity gap between coastal and prairie provinces.
Socioeconomic factors and policing strategies explain many variations. Dense populations correlate with higher property crime rates, while remote regions see different patterns. These insights help tailor safety programs to specific community needs rather than applying one-size-fits-all solutions.
Insights into Property Crimes and Youth-Related Offenses
Property-related incidents quietly shape community trust and safety more than most realize. While these offenses rarely dominate headlines, their frequency impacts daily life and long-term security perceptions. Recent reports reveal theft and fraud patterns that demand attention alongside shifts in youth behavior.

Trends in Property Crime Rates
Theft rates climbed 14% in urban centers last year, with vehicle break-ins driving much of the increase. A recent analysis shows fraud cases now account for 32% of property-related reports—a record high linked to digital payment adoption. Breaking and entering incidents remain concentrated in neighborhoods with visible wealth disparities.
When measured per 100,000 residents, these trends expose hidden risks. A mid-sized city might report 1,200 thefts annually, but adjusted for population, its crime rate could surpass larger metros. This metric helps prioritize resource allocation for maximum community impact.
Youth involvement in property offenses shows troubling patterns. Offenders under 18 account for 22% of shoplifting cases—a figure that’s remained steady despite overall declines. One analyst warns: “Early exposure to low-level offenses often correlates with escalated risks later.” Prevention programs targeting this group could reshape future severity index scores.
Law enforcement now combines traditional patrols with predictive analytics to address hotspots. These strategies reduced repeat incidents by 18% in pilot regions. By tracking both occurrence rates and societal impact, communities build smarter defenses against evolving threats.
Law Enforcement in Canada: Roles of the Police and RCMP
Effective law enforcement forms the backbone of community safety strategies across diverse regions. You’ll find stark contrasts in policing structures between urban centers and remote areas, shaped by population density and local needs.
Regional Distribution of Police Forces
Urban zones like Toronto and Vancouver average 185 officers per 100,000 residents—22% higher than rural regions. The RCMP handles 70% of northern territories’ law enforcement, while municipal agencies dominate metropolitan area operations. This table shows key contrasts:
| Region | Police per 100k | Primary Agency | Focus Areas |
|---|---|---|---|
| Major Cities | 185 | Municipal | Property crimes, cyber offenses |
| Rural Areas | 142 | RCMP | Drug trafficking, wildlife crimes |
| Northern Territories | 98 | RCMP | Search/rescue, indigenous community support |
Recent Initiatives in Policing and Community Safety
New hotspot policing strategies reduced property crime rates by 17% in Calgary last year. The RCMP’s Project Lock-Up expanded to 23 regions, targeting repeat offenders through data-driven patrols. “Collaboration between agencies turns raw data into safer streets,” notes an Edmonton police supervisor.
Community outreach programs now influence 40% of resource allocation decisions. Vancouver’s Block Watch 2.0 combines doorbell cameras with neighborhood apps, cutting burglaries by 29%. These efforts reshape how index canada metrics reflect real-world safety improvements.
Geospatial Exploration of Crime Data
Maps transform raw numbers into actionable insights when analyzing community safety. The Canadian Statistical Geospatial Explorer lets you visualize trends at hyper-local levels—down to individual neighborhoods. This tool reveals patterns hidden in broader regional reports.

Utilizing the Canadian Statistical Geospatial Explorer
This platform breaks data into dissemination areas—zones of 400-700 people. You can compare homicide rates per 100,000 residents between adjacent blocks or track youth-related incidents across school districts. Interactive layers highlight where specific offenses cluster over time.
| Region Type | Homicide Rate (per 100k) | Youth Crime Hotspots | Property Incident Density |
|---|---|---|---|
| Prairie Cities | 1.8 | 23% | High |
| Coastal Metro | 2.4 | 18% | Moderate |
| Northern Towns | 0.9 | 11% | Low |
Youth-related offenses show sharp geographic contrasts. Some urban cores report rates triple the national average, while rural zones see fewer incidents. One analyst notes: “Heatmaps expose where prevention programs could yield the highest returns.”
The tool also maps property crime concentrations. You’ll spot recurring theft patterns near transit hubs or commercial corridors. Overlaying economic data reveals connections between vacancy rates and break-in frequencies.
Winnipeg used these insights to redirect patrols to high-risk areas, cutting auto thefts by 31% in 18 months. Such case studies prove how granular geography shapes smarter safety strategies.
Data Sources and Methodologies Driving the Analysis
How do raw numbers become trusted safety insights? Transparent data collection processes transform scattered reports into actionable patterns. You’ll see how multiple streams of information merge to create reliable metrics that guide national policies.

Leveraging Statistics Canada Reports
Every rate calculation starts with police submissions and victimization surveys. Statistics Canada cross-references these with court records and coroner reports to verify accuracy. One analyst explains: “Three-step validation checks eliminate discrepancies before publication.”
Annual reviews update methodologies to capture emerging trends. For example, drug-related offenses now include synthetic opioid trafficking—previously overlooked in older frameworks. The National Justice Statistics Initiative standardizes definitions across provinces, ensuring urban and rural residents receive equal representation.
Forensic advancements also shape data quality. DNA matching reduced misclassified incidents by 14% since 2018. Multi-agency collaboration fills gaps—local patrol logs supplement federal databases to track youth offender patterns accurately.
These rigorous processes build public trust. When you review crime rates, you’re seeing aggregated insights from 2,300+ law enforcement agencies. Transparent documentation lets anyone audit calculation steps, proving why these metrics drive effective community solutions.
Comparative Analysis: Canada Versus Global Crime Trends
How does community safety here stack up against global standards? International benchmarks reveal surprising patterns when comparing incident rates and prevention strategies. The 2023 Global Peace Index ranks this nation 12th worldwide—safer than the U.S. but behind Germany and Japan in handling complex cases.

International Benchmarks and Crime Severity Comparisons
Homicide rates here average 2.1 per 100,000 residents—33% lower than the U.S. but double Norway’s. Robbery incidents show similar contrasts, with 73 occurrences annually per 100,000 people compared to 102 in France. These gaps highlight how services like neighborhood watch programs and data-driven policing influence outcomes.
Year-over-year trends reveal faster improvements in property-related offenses than peer nations. Since 2018, break-in rates dropped 19%—triple the OECD average decline. However, cyber-enabled incidents now account for 28% of reports here versus 34% in Australia, suggesting room for tech-focused services.
| Country | Homicide Rate | Robbery Rate | Cybercrime % |
|---|---|---|---|
| Canada | 2.1 | 73 | 28 |
| U.S. | 6.3 | 98 | 41 |
| Germany | 0.8 | 42 | 33 |
Justice systems also differ. While 78% of resolved incidents here involve non-custodial sentences, Sweden uses restorative approaches in 92% of cases. Analysts note: “Global best practices in rehabilitation could reshape local outcomes.”
Understanding these comparisons helps identify which services and policies deliver results. As nations share data through platforms like Interpol’s Global Crime Trends Report, communities gain actionable insights to refine safety strategies year after year.
Conclusion
Public safety evolves through patterns only visible in comprehensive analysis. You’ve seen how homicide rates fell while cyber-enabled offenses climbed—a paradox explained by system-level metrics like the Crime Severity Index. These insights reveal progress and persistent challenges shaping people’s daily lives.
Reliable data from trusted sources remains vital. Reports standardized per 100,000 residents expose risks hidden in raw counts. Law enforcement’s evolving strategies—from hotspot policing to community partnerships—show measurable impacts on incident trends.
Interactive tools like the Canadian Statistical Geospatial Explorer let people explore hyper-local patterns. This transparency helps communities advocate for tailored solutions. Behind these resources lies an integrated system merging police reports, economic indicators, and victim surveys.
Your next step? Use these platforms to track neighborhood-level changes or compare regional policies. For people shaping safety initiatives, understanding both numbers and their real-world context turns information into action.

