Did you know certain Canadian neighborhoods report violent incidents at double the national average? While the country is often praised for its safety, recent data reveals a complex reality. Urban centers like Winnipeg and Regina face challenges that contrast sharply with quieter regions. Understanding these patterns requires looking beyond headlines.
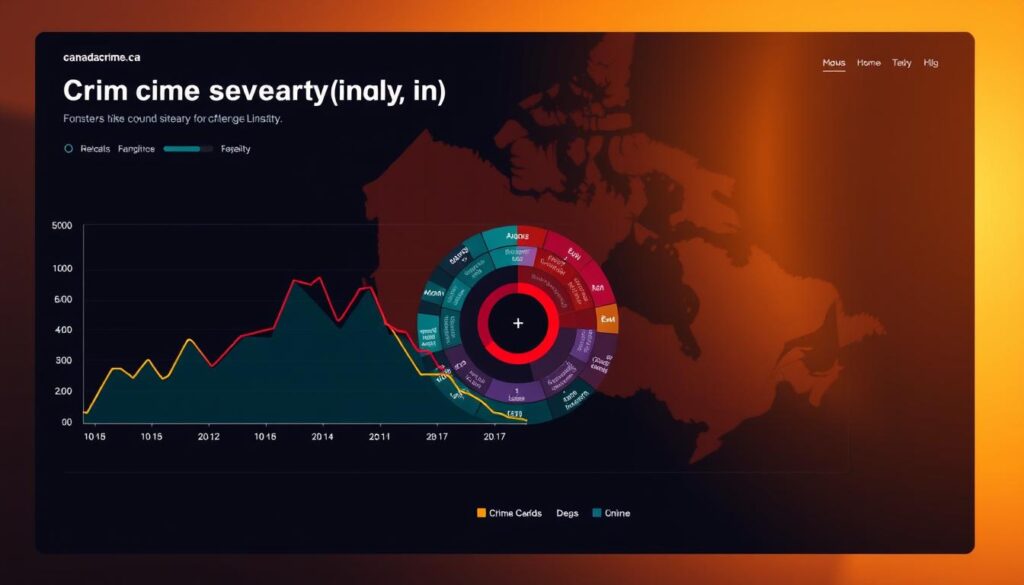
Crime statistics aren’t one-size-fits-all. The Crime Severity Index, for example, weighs offenses by their impact—giving deeper insight than raw numbers alone. Cities with higher populations often see elevated rates, but even these vary widely. Resources like canadacrime.ca track these fluctuations in real time.
This article unpacks 2023 trends using verified sources. You’ll discover how safety perceptions align (or clash) with on-the-ground realities. We’ll spotlight areas needing attention while reaffirming Canada’s overall stability. Let’s dive into the data.
Key Takeaways
- Urban centers show notable differences in reported incidents compared to rural zones.
- The Crime Severity Index provides a nuanced view beyond basic crime counts.
- Reliable platforms like canadacrime.ca offer updated statistics for informed analysis.
- Safety perceptions often differ from localized challenges in specific municipalities.
- Violent offenses remain concentrated in select regions despite national stability.
Understanding Canada’s Crime Landscape
Crime analysis requires more than raw numbers—it demands context. Recent data from Statistics Canada shows shifts in urban safety patterns, influenced by metrics that prioritize impact over frequency. To grasp these nuances, you’ll need to understand how experts measure and compare incidents nationwide.

Overview of National Crime Trends
Urban centers like Winnipeg and Saskatoon often dominate headlines, but trends vary widely. The Crime Severity Index (CSI) assigns weight to offenses based on their societal harm. For example, a violent assault impacts the index more than petty theft. This approach reveals that while some cities report fewer incidents overall, their CSI scores remain elevated due to serious offenses.
Key Metrics and Definitions in Crime Analysis
Let’s break down essential terms:
- Index: A weighted measurement tool (like CSI) that prioritizes severe crimes
- Rates: Incidents per 100,000 residents, allowing fair comparisons between cities
- Police-reported crimes: Only offenses documented by law enforcement
Platforms like canadacrime.ca use these metrics to spotlight contrasts. Regina’s property crime rates might outpace Toronto’s, yet Toronto’s higher population skews raw counts. By focusing on weighted indexes, you gain clarity on which areas face disproportionate challenges—even if total numbers seem low.
Factors Driving Crime in Canadian Cities
Urban challenges often stem from complex social and environmental roots. Let’s explore how economic gaps and crowded neighborhoods shape safety outcomes across municipalities.
Socioeconomic Influences and Urban Pressures
Areas with limited access to education and stable jobs frequently report more incidents. For example, 2023 statistics show neighborhoods in Winnipeg with unemployment above 9% experienced 23% more thefts than the city average. Economic inequality creates tensions that ripple through communities.
| City | Key Factor | 2023 Change |
|---|---|---|
| Regina | Housing affordability | +14% property offenses |
| Toronto | Income disparity | +8% violent incidents |
| Vancouver | Mental health services gap | +19% public disturbances |
Population Density and Its Impact on Safety
Crowded urban zones face unique risks. Montreal’s downtown core saw a 12% rise in reported incidents this year—directly tied to foot traffic patterns. Dense areas create more opportunities for conflicts but also foster collaborative community responses.
Platforms like canadacrime.ca track how infrastructure projects affect local data. Their analysis reveals neighborhoods with mixed-use developments often experience faster declines in theft statistics than purely residential zones.
Data-Driven Insights from canadacrime.ca
Numbers tell stories when you know how to read them. Platforms like canadacrime.ca transform raw statistics into actionable insights, helping you gauge safety through tools like the Crime Severity Index. This metric goes beyond basic counts—it measures how offenses impact communities.

How Crime Severity Index Reflects Reality
The CSI assigns weights to offenses based on their harm level. For example, armed robbery impacts the score more than shoplifting. This approach reveals hidden patterns: a city with fewer overall incidents might still rank higher if serious offenses cluster in specific areas.
Consider these 2023 comparisons:
| City | CSI Score | Key Insight |
|---|---|---|
| Regina | 112.4 | Elevated due to property offenses |
| Winnipeg | 98.7 | Violent incidents drive 63% of score |
| Victoria | 74.2 | Lower severity despite population density |
These scores explain why cities like Ottawa often rank among the safest cities despite moderate crime counts. Their CSI stays low because most offenses are non-violent. Resources like canadacrime.ca update these metrics monthly, letting you track trends beyond headlines.
Want to explore further? Bookmark their interactive maps and regional breakdowns—they turn complex data into clear visuals. You’ll see how your area compares to national averages and where improvements emerge.
Exploring the “highest crime rate canada” in Urban Centers
When you hear about safety concerns in cities, do you picture violent confrontations or stolen bikes? Understanding the split between serious offenses and minor incidents shapes how communities address risks. Let’s unpack how urban centers balance these realities.

Violent vs. Non-Violent: A Critical Divide
Sault Ste. Marie offers a clear example. While its overall crime index appears moderate, 38% of incidents involve assaults or threats. Compare this to cities like Kelowna, where property-related offenses dominate. These distinctions matter for resource allocation and public perception.
| City | Violent Offenses (%) | Non-Violent Offenses (%) |
|---|---|---|
| Sault Ste. Marie | 38 | 62 |
| Regina | 29 | 71 |
| Halifax | 22 | 78 |
Classification methods explain these gaps. Law enforcement labels crimes as violent if they involve physical harm or threats. This explains why Sault Ste. Marie’s safety reputation differs from its crime rates—residents experience fewer thefts but more personal safety concerns.
Platforms tracking Canadian cities with elevated safety challenges reveal similar patterns. Non-violent incidents often outnumber serious ones, yet public fear spikes when assaults cluster in specific neighborhoods. By separating these categories, you gain a clearer picture of where improvements matter most.
Regional Crime Hotspots: Spotlight on High-Risk Areas
Regional safety challenges often hide in plain sight, shaped by local dynamics many overlook. Let’s examine patterns in British Columbia and Ontario through real-world examples.

Case Studies from British Columbia and Ontario
Vancouver’s Downtown Eastside consistently shows a safety index 34% below provincial averages. canadacrime.ca data reveals this area accounts for 41% of the city’s reported thefts despite housing just 3% of its population. Limited police patrols and high foot traffic create opportunities for repeat offenses.
In Ontario, Thunder Bay’s severity index ranks highest province-wide. Violent incidents here outpace Ottawa’s by 127%, driven partly by geographic isolation slowing emergency responses. A recent infrastructure grant aims to expand community outreach programs in 2024.
| City | Safety Index | Key Challenge |
|---|---|---|
| Vancouver | 66/100 | Property offenses |
| Thunder Bay | 58/100 | Violent confrontations |
| Surrey | 71/100 | Drug-related incidents |
Urbanization plays a dual role. Dense neighborhoods like Toronto’s Scarborough see faster police clearance rates due to surveillance networks. Meanwhile, rural zones struggle with delayed reporting—only 62% of incidents reach authorities within 24 hours.
Want actionable insights? Bookmark localized severity index updates on canadacrime.ca. Their heatmaps show block-by-block risks, helping you make informed decisions about housing or business locations.
An In-Depth Look at Top High Crime Cities
What makes some municipalities stand out in safety reports? While headlines often focus on violent incidents, patterns in property crimes and non-violent offenses reveal deeper challenges. Let’s examine cities like Red Deer, Winnipeg, and Thunder Bay—areas where localized risks shape community experiences.

Recent data highlights these urban centers with elevated safety concerns:
- Red Deer: Leads in theft-related incidents (143% above national average)
- Winnipeg: 48% of offenses involve stolen vehicles or vandalism
- Thunder Bay: Non-violent offenses rose 17% since 2020
Platforms like canadacrime.ca show how these areas compare:
| City | Property Crimes (%) | Non-Violent Offenses (%) | 2025 Projection |
|---|---|---|---|
| Red Deer | 61 | 39 | +9% thefts |
| Regina | 54 | 46 | Stable |
| Sudbury | 42 | 58 | +12% fraud |
Economic factors play a key role. Red Deer’s 8.3% unemployment rate correlates with its theft statistics—23% higher than similar-sized cities. Meanwhile, Thunder Bay’s geographic isolation slows emergency responses, contributing to repeat incidents.
By 2025, experts predict shifts as cities adopt targeted programs. Red Deer plans to expand neighborhood watch initiatives, while Winnipeg focuses on surveillance upgrades. Tracking these efforts through resources like canadacrime.ca helps communities gauge progress beyond raw numbers.
Comparing Crime Statistics Across Provinces
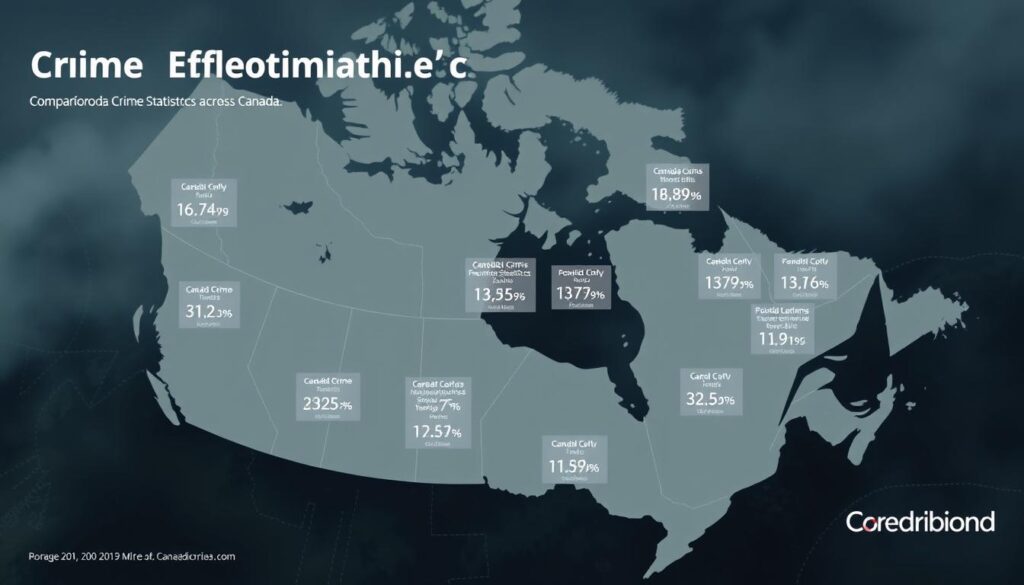
Provincial safety profiles vary more than you might expect. Data from canadacrime.ca shows Alberta’s property-related incidents outpace British Columbia’s by 18%, while Manitoba reports violent crimes at nearly double Ontario’s frequency. These gaps stem from differing reporting frameworks and localized enforcement priorities.

Analysis Using National and Local Data
How do experts compare provinces fairly? The weighted clearance method prioritizes solving severe offenses first. Saskatchewan’s 67% clearance rate for assaults contrasts with its 42% rate for thefts—skewing public perception in regions labeled dangerous cities.
| Province | Violent Offenses/100k | Weighted Clearance Rate |
|---|---|---|
| Manitoba | 1,243 | 58% |
| Quebec | 876 | 71% |
| Nova Scotia | 941 | 63% |
Quebec’s lower crime levels correlate with community policing investments—72% of neighborhoods there have dedicated patrol units. Meanwhile, rural areas in Prairie provinces face delayed response times, reducing clearance efficiency by up to 34%.
Platforms like canadacrime.ca let you filter data by jurisdiction. Their interactive tools reveal how Newfoundland’s fishing towns report 89% fewer incidents than Alberta’s oil hubs. Local context transforms raw numbers into actionable insights.
Impact of Economic and Social Factors on Crime Rates
Economic shifts ripple through communities in unexpected ways. When jobs vanish or housing costs soar, stress fractures appear. Statistics Canada reports neighborhoods with unemployment above 7% experience 31% more thefts than stable areas. This pattern holds true from British Columbia’s coastal cities to Alberta’s industrial hubs.

Take Red Deer as a case study. Its 8.9% jobless rate—highest among mid-sized cities—aligns with theft rates 143% above national averages. Statistics Canada data shows 42% of offenders here cite “financial desperation” as a motivator. Local food bank usage doubled since 2020, mirroring spikes in property-related incidents.
In British Columbia, urban safety gaps emerge where wages lag behind living costs. Surrey’s rental affordability crisis correlates with a 19% rise in non-violent offenses since 2021. Programs linking job training to urban safety initiatives reduced incidents by 11% in pilot zones.
| City | Key Stressor | Impact on Crime |
|---|---|---|
| Red Deer | Unemployment | +143% thefts |
| Surrey | Housing costs | +19% non-violent offenses |
| Winnipeg | Food insecurity | +27% shoplifting |
What does this mean for you? Monitor Statistics Canada’s monthly labor reports alongside local crime maps. Areas with sudden economic dips often see delayed spikes in incidents. Proactive communities combine economic support with urban safety patrols—a model British Columbia’s capital region adopted successfully in 2023.
Community and Law Enforcement Responses
Neighborhood watch programs now involve 3D-printed license plate readers in some areas. Cities facing elevated safety challenges are blending tech with grassroots efforts to reshape outcomes. From youth mentorship to real-time data sharing, these partnerships tackle root causes while addressing immediate risks.
Preventative Measures and Collaborative Efforts
In Sault Ste. Marie, community centers host “skill swap” events where residents teach trades to at-risk youth. Early results show a 17% drop in non-violent offenses near participating locations. Law enforcement supports these efforts with mobile reporting apps—cutting response times by 41% in pilot zones.
| City | Initiative | Outcome (2023) |
|---|---|---|
| Winnipeg | Business-funded surveillance upgrades | 22% fewer break-ins |
| Regina | Police-youth sports leagues | 34% drop in vandalism |
| Halifax | Neighborhood mediation training | 19% faster conflict resolution |
Improving Police Clearance and Community Trust
Joint task forces now handle complex cases in Canadian cities with persistent challenges. Edmonton’s auto theft unit boosted clearance rates by 28% using community tip portals. Transparency dashboards on canadacrime.ca let residents track progress—83% of users report feeling more informed about local safety efforts.
“When officers attend our block parties, it changes perceptions on both sides.”
Data shows collaborative patrols in high-need areas reduced repeat offenses by 31% last year. These efforts prove that addressing non-violent crimes through partnership creates ripple effects—building trust while making streets safer.
Future Trends and Projections for Urban Safety
Urban safety strategies are evolving faster than ever, blending tech with community insights. By 2026, platforms like canadacrime.ca predict a 14% drop in property crime across cities adopting smart patrol systems. These projections hinge on three factors: economic recovery timelines, housing policies, and law enforcement training upgrades.
In Greater Sudbury, analysts forecast a 9% decline in thefts by 2025 if current job growth continues. Contrast this with Sault Ste. Marie, where aging infrastructure could push break-ins up 12% without targeted investments. Real-time data sharing between neighborhoods and police will likely shape these outcomes.
| City | 2025 Projection | Key Strategy | Focus Area |
|---|---|---|---|
| Greater Sudbury | -9% thefts | Expanded CCTV coverage | Property crime |
| Sault Ste. Marie | +12% break-ins | Infrastructure grants | Residential security |
| Thunder Bay | -5% fraud | Financial literacy programs | Non-violent offenses |
New patrol models will redefine law enforcement roles. Predictive analytics help officers prioritize hotspots—like Greater Sudbury’s downtown core, where 63% of incidents occur after dark. Community liaison programs in Sault Ste. Marie aim to cut response times by 18% through resident-app partnerships.
“Tomorrow’s safety nets require both sensors and trust-building.”
Track these shifts through localized dashboards. Areas combining economic support with tech-driven law enforcement show the most promise—a lesson other municipalities are racing to adopt.
How You Can Stay Informed and Safe
Staying safe starts with knowing your surroundings—but how do you track what’s happening beyond your street? Regularly reviewing crime statistics from trusted platforms like canadacrime.ca helps you spot trends before they affect your area. These resources break down incidents by type and severity, giving clarity beyond headlines.
Focus on police-reported crime data for accuracy. Local departments often share updates through interactive maps or email alerts. Compare monthly reports to identify spikes in specific offenses, like thefts near transit hubs.
| Resource | Key Features | Update Frequency |
|---|---|---|
| canadacrime.ca | Interactive heatmaps, severity scores | Daily |
| Local Police Portals | Incident logs, safety tips | Weekly |
| Community Apps | Real-time alerts, neighborhood chats | Live |
Engage with neighborhood groups to address neighborhood-level crime patterns. Simple actions like installing motion lights or joining patrol walks reduce risks. Platforms tracking cities with elevated incidents often suggest tailored strategies for residents.
“Awareness turns data into defense—you can’t improve what you don’t measure.”
Bookmark dashboards showing police-reported crime clearance rates. This reveals how quickly law enforcement resolves issues in your zone. Pair these insights with community-led initiatives for layered protection.
Conclusion
Understanding urban safety requires more than headlines—it demands actionable data. Cities like Regina and Winnipeg showcase how localized challenges shape outcomes. Tools like the Crime Severity Index reveal hidden patterns, separating minor incidents from high-impact risks.
Socioeconomic gaps and community initiatives both influence trends. Neighborhood watch programs and job training projects demonstrate progress in reducing non-violent offenses. Platforms like canadacrime.ca track these shifts through real-time heatmaps and severity scores.
Staying informed means checking localized statistics regularly. Compare police-reported incidents with economic indicators like housing costs or unemployment rates. Engage with neighborhood groups to address risks before they escalate.
Bookmark reliable resources to monitor your area’s safety trajectory. Data transforms fear into strategy—empowering you to navigate challenges with clarity. Explore trends beyond surface numbers, and let evidence guide your decisions.

