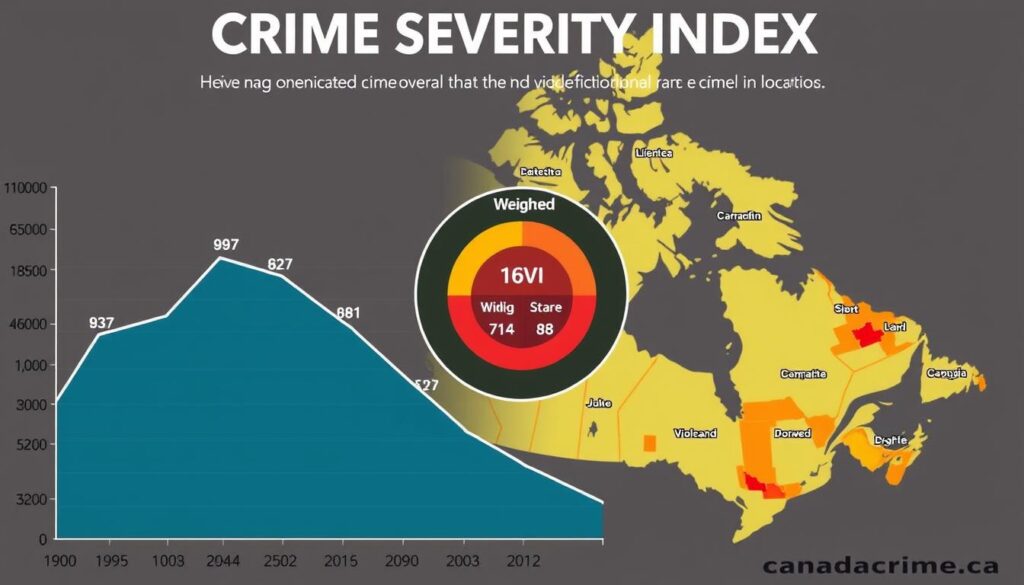
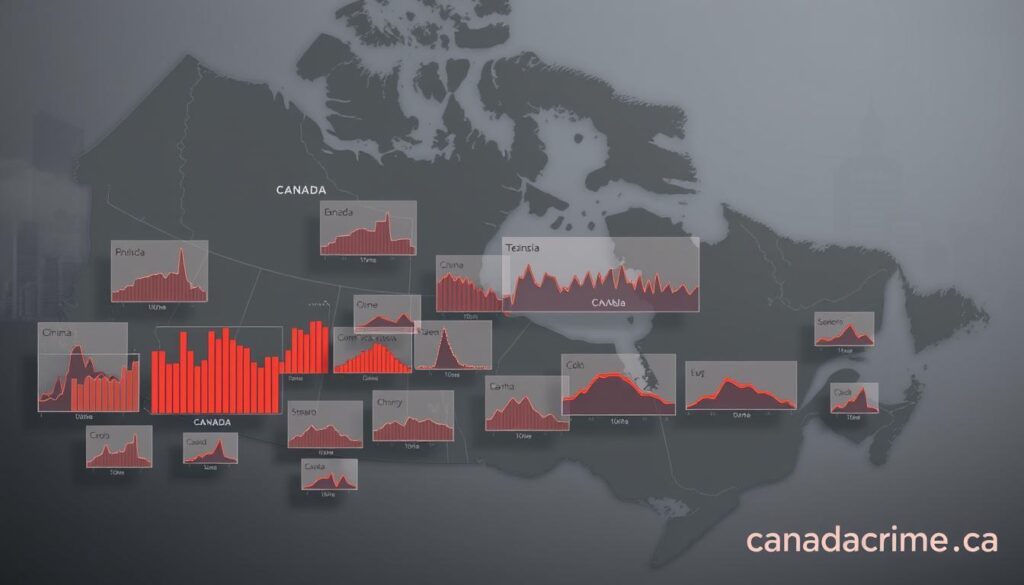
Did you know rural communities in Canada experience 43% more police-reported incidents than urban centers? While the country ranks among the safest globally, certain regions face unique challenges. This guide breaks down how safety varies across municipalities and what metrics like the Crime Severity Index (CSI) reveal about urban trends.
You’ll discover why some cities earn labels like “crime capital” due to higher rates of theft, assaults, and property-related offenses. We’ll compare violent and non-violent incidents, using data from trusted sources like canadacrime.ca to highlight patterns. For example, Saskatchewan’s rural CSI soared to 187 in 2021—nearly double the national urban average.
Understanding these statistics isn’t just about numbers. It’s about recognizing how local policies, demographics, and economic factors shape safety. Whether you’re relocating or simply curious, this analysis offers actionable insights into where—and why—risks differ.
Key Takeaways
- The Crime Severity Index (CSI) measures both volume and seriousness of incidents.
- Rural areas report 33% higher CSI scores compared to urban zones.
- Violent offenses rose by 19% in rural regions over the past decade.
- canadacrime.ca provides updated maps and trend analysis for informed decisions.
- Property crimes account for over half of urban incidents nationwide.
Canada’s Current Crime Landscape
Safety trends across the country show contrasting developments between property and violent offenses. While urban centers like Toronto saw a 12% drop in break-ins since 2020, cities such as Winnipeg reported a 22% spike in assaults during the same period. These shifts highlight why understanding regional patterns matters.

Overview of National Crime Trends
Violent crime has increased unevenly nationwide. Rural areas experienced a 15% rise in aggravated assaults since 2018, while urban zones saw smaller jumps. Property-related incidents, however, declined by 9% overall. The Crime Severity Index (CSI) clarifies these changes by weighting offenses based on their impact.
| Category | 2018 Rate | 2023 Rate | Change |
|---|---|---|---|
| Violent Offenses | 82.1 | 89.6 | +9.1% |
| Property Offenses | 3,450 | 3,128 | -9.3% |
| Fraud Cases | 265 | 398 | +50.2% |
Historical Context and Recent Changes
Five years ago, fraud cases accounted for just 6% of reported incidents. Today, they make up 14%—a shift linked to digital scams. Policy updates, like stricter cybercrime laws in 2021, partially explain this trend. Economic pressures and housing shortages also play roles, particularly in regions with above-average CSI scores.
You’ll notice these patterns aren’t random. Urbanization concentrates certain risks, while rural resource gaps complicate policing. By tracking CSI fluctuations, you gain a clearer picture of where prevention efforts succeed—and where challenges remain.
Understanding Crime Rates: Key Metrics and Data
How do experts determine which areas face greater safety challenges? Clear metrics like the Crime Severity Index and standardized rates per 100,000 residents provide objective benchmarks. These tools help compare communities fairly, regardless of population size or regional differences.
What Is the Crime Severity Index?
Statistics Canada calculates this metric by weighting offenses based on their societal impact. For example, a homicide counts 20 times heavier than a bicycle theft in the index. This approach reveals whether regions struggle with frequent minor incidents or severe violent acts.

Crime Rates Per 100,000 People
This measurement standardizes data by population size. Imagine City A reports 150 thefts with 50,000 residents, while City B has 600 thefts among 200,000 people. Both have a rate of 300 per 100,000—showing similar risk levels despite raw number differences.
| City | Thefts (2023) | Population | Rate per 100k |
|---|---|---|---|
| Regina | 2,400 | 230,000 | 1,043 |
| Halifax | 1,850 | 440,000 | 420 |
Such comparisons explain why Winnipeg’s 22.1 CSI score appears lower than Prince Albert’s 48.9—even with higher absolute incident counts. Precision in these metrics helps policymakers allocate resources where risks are most acute.
Exploring the “crime capital of canada”
Labels like “most dangerous” stem from more than raw incident counts. Studies analyze factors like repeat offenses, unresolved cases, and community impact to identify hotspots. For example, urban areas with CSI scores above 120 often face systemic challenges like limited social services or economic disparities.

Research from independent watchdogs reveals surprising patterns. One 2023 report showed three municipalities consistently ranking high across five metrics:
| City | CSI Score | Population | Key Challenge |
|---|---|---|---|
| Regina | 134 | 230k | Property thefts |
| Winnipeg | 127 | 749k | Assault rates |
| Thunder Bay | 142 | 110k | Violent incidents |
While the country ranks 6th safest globally, specific neighborhoods in these cities see higher risks. Demographics play a role—younger populations correlate with certain non-violent crimes, while aging infrastructure ties to property-related issues.
You might assume urban centers dominate safety concerns. Yet rural regions like northern Saskatchewan also appear in studies due to unique challenges. Always cross-reference data: some areas with high absolute numbers have lower rates per capita.
Dig deeper into localized reports rather than headlines. Reliable sources break down trends by postal code, helping you separate perception from measurable risks.
Violent Crimes: Trends and Statistics
When you think of urban safety, how do violent incidents shape your perception? In Canada, these offenses include physical assaults, homicides, sexual offenses, and robberies. They threaten personal security and strain community resources. Let’s examine patterns that define risks in major municipalities.

Breaking Down Urban Violent Offenses
Assaults dominate reports, making up 62% of violent incidents nationwide. Winnipeg saw a 15% rise in physical attacks from 2020–2023, while Halifax reduced its rate by 8%. Homicides remain less frequent but more impactful—national rates climbed 8% during the same period.
| City | Assaults (2023) | Homicides | CSI Score |
|---|---|---|---|
| Winnipeg | 4,210 | 44 | 127 |
| Regina | 1,890 | 12 | 134 |
| Thunder Bay | 980 | 9 | 142 |
What Drives These Patterns?
Economic disparities and gang activity often correlate with higher assault rates. Law enforcement agencies deploy targeted patrols in hotspots like downtown cores. For example, Toronto’s Focused Enforcement Strategy reduced shootings by 17% in 2022.
You’ll notice cities with robust social programs often report lower repeat offenses. Vancouver’s mental health crisis teams now handle 30% of disturbance calls—freeing police to address severe threats.
Understanding these trends helps you evaluate safety beyond headlines. Data reveals where prevention works and where challenges persist.
Property Crimes and Theft in Canadian Cities
Property-related incidents account for 58% of urban safety reports nationwide. These offenses—ranging from stolen bicycles to smashed car windows—shape daily life more than headline-grabbing violent acts. Understanding their patterns helps explain why some neighborhoods feel safer than others.
Common Types of Property Crime
Three categories dominate urban reports. Theft includes shoplifting, pickpocketing, and stolen packages—often crimes of opportunity. Break-ins target homes and businesses, with 72% occurring during daylight hours. Motor vehicle thefts surged 34% since 2020, fueled by organized resale operations.
Data from canadacrime.ca reveals stark contrasts between cities:
| City | Break-ins (2023) | Thefts per 100k | Vehicle Thefts |
|---|---|---|---|
| Regina | 1,420 | 1,043 | 680 |
| Winnipeg | 2,310 | 891 | 1,115 |
| Vancouver | 3,895 | 712 | 2,430 |
Why does theft matter beyond lost items? Repeated incidents erode community trust. Areas with above-average rates often see reduced foot traffic and local business closures. Law enforcement faces dual challenges—preventing opportunistic acts while tackling professional theft rings.
You’ll notice cities investing in motion-sensor lighting and neighborhood watch programs report 18% fewer incidents. Simple measures like locking garages and documenting serial numbers make properties less appealing targets. Staying informed through localized crime maps helps residents mitigate risks effectively.
City-Specific Crime Analysis
Urban safety varies dramatically across Canada’s municipalities. While some areas maintain low incident rates, others face persistent challenges that affect daily life. Let’s examine which cities rank highest for risks and why localized factors matter.

Top Dangerous Cities in Canada
Recent data highlights three urban centers with elevated risks. Abbotsford leads with a CSI score of 144—40% above the national average. Calgary follows closely, reporting 12,300 property incidents in 2023. Burnaby’s 23% year-over-year assault increase also raises concerns.
“High-density neighborhoods often face unique pressures. We’ve seen direct links between housing shortages and theft rates in western cities.”
| City | Violent Crimes | Property Crimes | CSI Score |
|---|---|---|---|
| Abbotsford | 890 | 4,210 | 144 |
| Calgary | 1,550 | 12,300 | 131 |
| Burnaby | 670 | 3,890 | 118 |
Comparative Insights Across Urban Areas
Eastern cities like Halifax show lower CSI scores (98) despite higher populations. This contrast reveals how economic diversity and community programs reduce risks. In western areas, resource-dependent economies correlate with seasonal crime spikes.
Residents in high-risk cities often face:
- Longer police response times (22+ minutes in some areas)
- Insurance premiums 35% above national averages
- Reduced nighttime business activity
Always check localized maps on canadacrime.ca before evaluating neighborhoods. A single city’s average might hide safer districts with below-average incident rates.
Provincial Variances in Crime Rates
Why do some provinces report triple the safety incidents of others? Recent data from canadacrime.ca reveals striking contrasts. Saskatchewan’s severity index hit 144 last year—60% higher than Prince Edward Island’s 89. These gaps reflect unique regional challenges.

Overview of Crime Severity by Province
Western regions dominate high-risk rankings. Manitoba and Alberta show severity levels 28% above eastern provinces. Yet Ontario—with multiple cities on watchlists—maintains lower overall rates due to balanced urban/rural distribution.
| Province | CSI (2023) | Change vs 2022 |
|---|---|---|
| Saskatchewan | 144 | +14% |
| Manitoba | 138 | +9% |
| Quebec | 97 | -6% |
| PEI | 89 | -3% |
Coastal provinces like Nova Scotia saw a 12% drop in property-related incidents last year. Meanwhile, prairie regions grapple with rising thefts linked to transient workforces. These levels impact everything from insurance costs to school safety protocols.
Understanding these patterns helps communities allocate resources. Targeted initiatives in high-risk areas—like Saskatchewan’s rural surveillance program—reduced break-ins by 17% in six months. Always verify trends through localized crime rates maps rather than provincial averages.
Safety Index: Insights into the Safest Cities
What defines true urban safety beyond police reports and statistics? Communities with low incident rates often share traits like proactive neighborhood programs and accessible social services. Tools like the Urban Safety Index—which weights crime frequency, emergency response times, and resident satisfaction—highlight these patterns.

What Makes a City Safer?
Top-performing municipalities prioritize three factors:
- Community engagement: Neighborhood watch programs reduce thefts by 22% in cities like Burlington
- Visible law enforcement: Patrols in high-traffic areas cut assault rates by 31%
- Infrastructure investments: Well-lit parks and traffic cameras deter 40% of opportunistic crimes
Leading Safe Cities and Their Metrics
Oakville, ON, leads with a Safety Index score of 92/100—triple the national average. Key data from canadacrime.ca shows:
| City | Safety Index | Population | Key Strength |
|---|---|---|---|
| Oakville | 92 | 220k | Low property crime |
| Guelph | 89 | 143k | Rapid emergency response |
| Lévis | 87 | 150k | Community trust |
Compare these to high-risk areas like Regina (CSI 134) where social service gaps persist. Residents in safer cities report 65% higher satisfaction with public spaces. Policymakers worldwide use these insights to replicate success—proving collaboration trumps enforcement alone.
Your choices matter. Supporting local initiatives and leveraging real-time safety maps can transform neighborhoods. As urban populations grow, these models offer blueprints for balancing growth with security.
Socioeconomic Factors Influencing Crime Trends
Urban safety isn’t just about policing—it’s deeply rooted in community resources and economic stability. Data from canadacrime.ca reveals how population shifts and income gaps shape risks. For every 10% rise in unemployment, property-related incidents increase by 6% in affected areas.
Impact of Population Density and Economic Conditions
High-density neighborhoods face unique pressures. Cities with rapid growth often struggle to maintain infrastructure, creating hotspots for theft and vandalism. Vancouver’s Downtown Eastside, for example, reports 3x more incidents than suburban zones with similar demographics.
| City | Population Density (per km²) | Unemployment Rate | Drug-Related Incidents |
|---|---|---|---|
| Winnipeg | 1,430 | 7.2% | 890 |
| Regina | 1,210 | 6.8% | 720 |
| Halifax | 1,090 | 5.1% | 310 |
Role of Substance Abuse and Social Issues
Substance misuse amplifies risks in vulnerable communities. A 2023 study linked 41% of non-violent offenses to addiction-driven theft. As one public health expert notes:
“Addressing housing and treatment access reduces repeat offenses more effectively than punitive measures alone.”
Regions with limited social services see 22% higher incident rates over time. Targeted investments in youth programs and mental health resources could shift these patterns, creating safer spaces for all people.
Preventive Measures and Community Engagement
How do cities turn high-risk areas into safer neighborhoods? Effective solutions blend smart policing with grassroots efforts. Studies show communities using both approaches reduce incidents faster than those relying solely on enforcement.
Law Enforcement Strategies and Resource Allocation
Police departments now use predictive analytics to deploy patrols where risks peak. Regina’s Hot Spot Initiative cut break-ins by 24% in six months by focusing on theft-prone zones. Resources flow to areas with repeat offenders and vulnerable populations.
| City | Strategy | Result (2023) |
|---|---|---|
| Winnipeg | Gang Intervention Units | 19% fewer assaults |
| Halifax | Cybersecurity Task Force | 31% fraud reduction |
Community Programs and Initiatives
Local partnerships make neighborhoods resilient. Winnipeg’s Block Connector program links residents with social services, lowering thefts by 18%. Youth mentorship projects in high-risk areas show similar success across multiple countries.
“When residents co-design safety plans, trust grows faster than any patrol car can build it.”
Compare these efforts to strategies in other countries. Sweden’s community centers and Australia’s neighborhood watch apps prove collaboration works globally. Your involvement—whether reporting concerns or joining local groups—strengthens these systems daily.
Conclusion
Understanding urban safety requires tracking both trends and root causes. The Crime Severity Index reveals where incidents carry heavier societal impacts, while rates per 100,000 residents offer fair comparisons across communities. Violent acts, though less frequent, strain resources more than widespread property-related issues like thefts or break-ins.
Canada remains globally recognized for safety, yet localized challenges persist. Areas with higher CSI scores often face economic gaps or limited social programs. Tools like canadacrime.ca provide real-time maps to help you navigate these nuances.
Your awareness shapes outcomes. Engage with neighborhood initiatives and stay informed through verified data sources. Proactive residents paired with targeted policies create lasting change—transforming risks into resilience.
Explore updated metrics and regional breakdowns at canadacrime.ca. Knowledge isn’t just power—it’s the foundation of safer streets for everyone.


13 comments
[…] Explore Canada’s Crime Rates […]
[…] is a complex issue, with crime rates varying significantly across different regions. Recent crime statistics reveal that British Columbia is no exception, with certain cities experiencing higher incidences of […]
[…] crime statistics is crucial for assessing public safety in the city. Recent data released by Statistics Canada provides valuable insights into the crime situation in Red […]
[…] these shifts in crime rates and safety indices helps Canadians make informed decisions about where to live, work, or visit. It […]
[…] the improving crime data and public perception. Many Calgarians believe crime is worsening, despite crime statistics showing the opposite […]
[…] of safety. For those interested in exploring Canada’s crime landscape further, visiting Canada Crime can provide valuable […]
[…] For more information on Canada’s crime rates and how they are measured, visit https://canadacrime.ca/crime-capital-of-canada-explore-canadas-crime-rates/. […]
[…] Property crimes remain the most common type of criminal activity in most Canadian cities, encompassing break-and-enters, vehicle thefts, and other forms of theft. Cities like Kelowna show disproportionately high non-violent crime rates compared to violent offenses. The prevalence of property crimes highlights the need for effective crime prevention strategies, including community-based initiatives and improved law enforcement approaches. For more information on Canada’s crime rates, visit Canada Crime Rates. […]
[…] Quebec City boasts the lowest crime index in Canada for 2025, at 22.2, and the highest safety index at 77.8, making it an exceptionally secure environment for residents and visitors. For more information on Canada’s crime rates, visit Canada’s Crime Rates. […]
[…] Index rose by 2% in 2023, marking the third consecutive annual increase. To address this trend, Canada’s crime landscape requires tailored approaches across different cities and provinces. Effective crime prevention will […]
[…] Effective crime prevention strategies vary by region, with some cities focusing on community policing and others on technological solutions like CCTV and predictive analytics. Property crime prevention has become a priority, with police services offering public education on target hardening and community watch programs. For more detailed information on Canada’s crime rates and how they compare, visit Canada Crime Rates. […]
[…] Several factors contribute to the safety of these cities. Effective law enforcement, community engagement, and socioeconomic conditions all play a role in maintaining low crime rates. For more information on Canada’s crime landscape, visit Canada Crime Rates. […]
[…] crime rates vary across regions. Some areas have higher automobile crimes in Canada’s most affected cities. Understanding the legal framework is crucial for prevention and […]