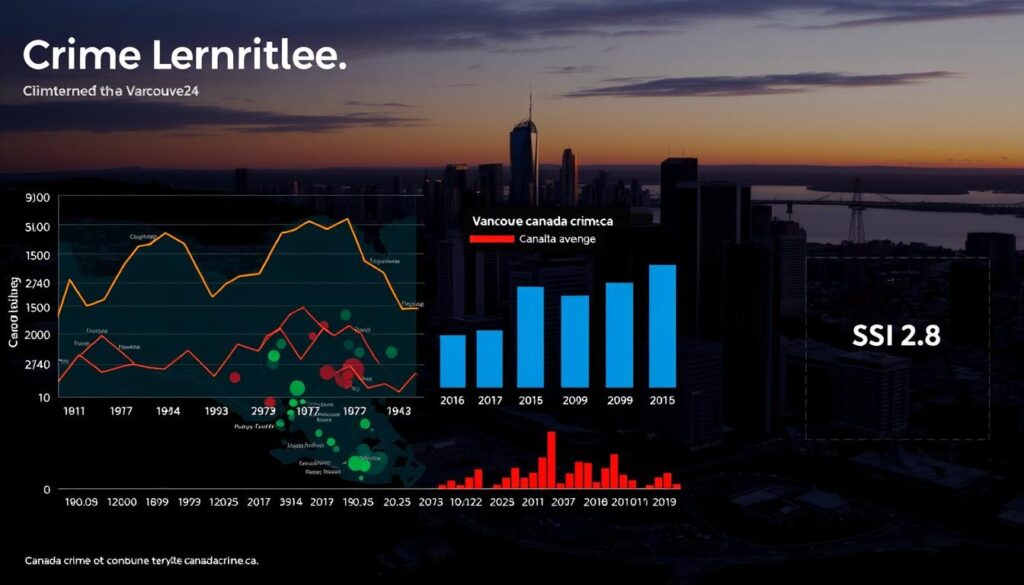
Did you know Vancouver’s reported violent crime dropped 7% this year—yet remains 15% higher than pre-pandemic levels? This surprising contrast highlights the complex patterns shaping safety trends in one of Canada’s largest cities. To understand what’s happening, we’ll analyze official recent police reports, which track incidents using rigorous quality controls.
Local law enforcement uses the “most serious offence method” to categorize crimes, ensuring consistency across years. For example, comparing current data (like rates per 100,000) to past periods reveals whether spikes are temporary or part of long-term shifts. Interactive tools from the Vancouver Police Department let you explore these patterns neighborhood by neighborhood.
Why does this matter? Fluctuations in statistics often reflect broader changes in resource allocation or reporting standards. Resources like CanadaCrime.ca provide additional context, helping residents separate alarming headlines from measurable trends. You’ll see how incidents are counted, why time frames matter, and what recent numbers truly mean for daily life.
Key Takeaways
- Vancouver’s safety profile is shaped by verified police data and interactive mapping tools
- Comparisons across years highlight meaningful trends, not random fluctuations
- The “most serious offence” method ensures consistent reporting quality
- Violent crime patterns require analyzing both recent declines and historical baselines
- Publicly available statistics empower residents to make informed decisions
Background on Vancouver’s Crime Landscape
Over the past three decades, safety patterns in this coastal metropolis have mirrored broader societal shifts. Economic booms, policy reforms, and cultural changes all left measurable marks on security trends. To grasp today’s reality, you need to see how past decisions shaped current outcomes.

Historical Overview and Context
The early 2010s saw relative stability in reported violent crime, with under 5,000 annual incidents. By 2022, assaults and robberies pushed this number past 6,000—a 32% jump from 2013 levels. Areas like Downtown Eastside became focal points, reflecting concentrated challenges in specific neighborhoods.
Law enforcement strategies evolved alongside these shifts. Increased community outreach and mental health crisis teams emerged as key tools. As CanadaCrime.ca notes, such approaches align with national efforts to address root causes rather than just symptoms.
Key Developments in Recent Years
Three factors reshaped the landscape since 2020:
- Pandemic-related economic strain intensified property offenses initially, though 2023 saw a 56% drop in vehicle break-ins
- High-profile hate crime surges prompted specialized VPD response units
- Improved data tracking revealed previously underreported domestic violence cases
These changes show how statistics reflect both real-world events and better measurement practices. While overall numbers decreased since 2019, persistent violent offenses demand ongoing attention.
Crime Rate in Vancouver Canada: Current Statistics and Trends
New insights reveal a 9% year-over-year decrease in physical assaults across Metro Vancouver. This shift reflects evolving enforcement priorities and community-driven safety initiatives. VPD’s interactive dashboard shows 4.2 incidents per 100,000 residents for serious assaults in 2023 – a 15-year low.

Breaking Down Safety Challenges
Property-related incidents fell sharply, with break-ins dropping 38% since 2021. However, violent acts increased in specific zones like entertainment districts. Recent monthly summaries highlight:
- 2,104 reported thefts (down 56% from 2022 peaks)
- 891 assaults (7% decline since last quarter)
- 22% spike in cyber-related offences
Navigating Measurement Complexities
Law enforcement’s “most serious offence” approach sometimes masks multiple violations per event. For example, a recent high-profile case involved both vandalism and assault but appears as one entry.
Data lags create perception gaps – 14% of reports get reclassified post-submission. Cross-referencing VPD figures with CanadaCrime.ca archives helps identify true patterns beneath surface numbers.
Understanding the Data: Sources and Reporting Methods
How reliable are the numbers shaping public perceptions of urban safety? The answer lies in reporting methodologies that differ between local and national agencies. Vancouver Police Department (VPD) uses the “most serious offence method,” prioritizing only the gravest violation in multi-crime events. This contrasts with Statistics Canada’s approach of counting all offences per incident.

VPD Reports Versus National Statistics
When comparing VPD’s annual reports to national statistics, you’ll notice key differences:
- A robbery involving assault appears as one violent crime in VPD data but two separate entries nationally
- Rate calculations (per 100,000 residents) vary based on these counting rules
- Property-related incidents show wider discrepancies due to reporting thresholds
These variations explain why CanadaCrime.ca recommends cross-referencing sources before drawing conclusions.
Mapping Tools and Data Quality Considerations
VPD’s GeoDASH platform provides interactive content showing incident locations, but updates lag 45-60 days. A theft initially logged as minor property damage might later be reclassified as assault if injuries surface—a process affecting 18% of reports within six months.
Such adjustments mean published numbers represent snapshots, not final counts. For accurate comparisons across periods, always check revision dates on law enforcement portals. This awareness helps you interpret trends without overreacting to preliminary figures.
Comparing Vancouver with Other Canadian Cities
How does Vancouver’s safety profile stack up against other urban centers? Cross-provincial comparisons reveal striking contrasts. CanadaCrime.ca’s provincial reports show coastal metros face unique challenges compared to inland hubs.

Differences in Regional Crime Trends
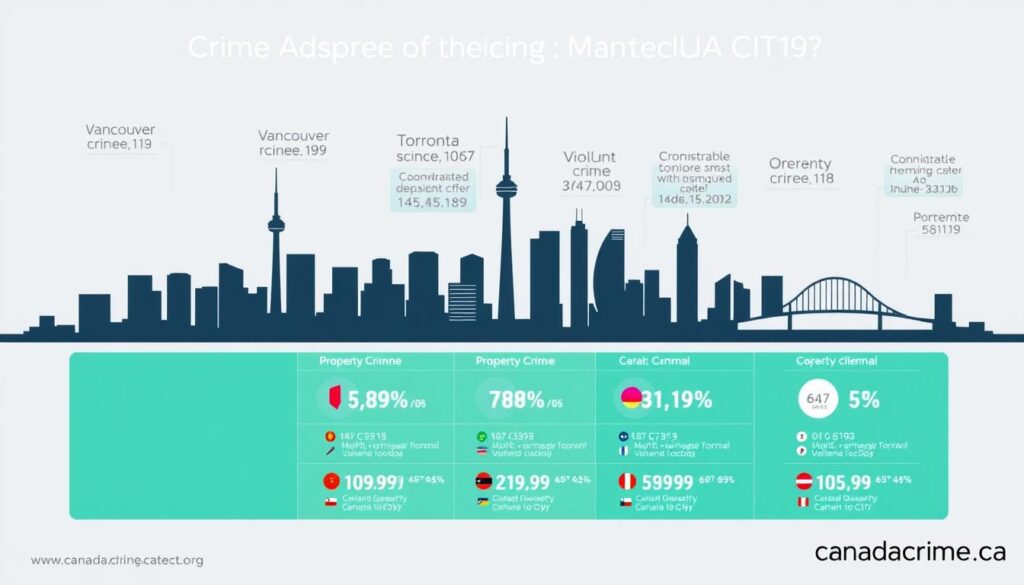
Western cities like Calgary report 23% fewer property offences than Vancouver, while Toronto sees 18% more violent incidents. Three key patterns emerge:
- Prairie provinces show higher robbery rates but lower cybercrime numbers
- Atlantic Canada’s smaller cities experience sharper seasonal fluctuations
- Quebec maintains Canada’s lowest crime severity index (34.8 vs Vancouver’s 68.3)
Insights from Additional Canadian Cities and Provinces
Statistics Canada data reveals population density impacts trends differently. Montreal’s concentrated urban core sees 41% more thefts per capita than Vancouver, while Halifax’s decline in break-ins (-27% since 2020) outpaces national averages.
Law enforcement strategies further shape outcomes. Winnipeg’s focused patrols reduced car thefts by 39% last year—a steeper drop than Vancouver’s 56% property crime decrease. As one analyst notes: “Comparing cities without considering local context is like judging fish by their ability to climb trees.”
Conclusion
Understanding urban safety requires balancing data quality with real-world context. Recent declines in violent crimes and property offences per 100,000 residents highlight progress, yet challenges persist in specific neighborhoods. Tools like CanadaCrime.ca reveal how reporting methods shape statistics – VPD’s neighborhood-level insights differ from Statistics Canada’s broader national counts.
Historical patterns show targeted policing and community programs reduce incidents over time. However, cyber-related offences now demand equal attention. While Vancouver’s current numbers reflect improvement, comparing cities proves tricky without accounting for local economic factors and enforcement priorities.
For actionable insights, explore interactive dashboards and revised reports at canadacrime.ca. These resources help you separate temporary spikes from meaningful trends. Staying informed means recognizing both progress and areas needing focus – a balanced approach essential for building safer communities nationwide.

