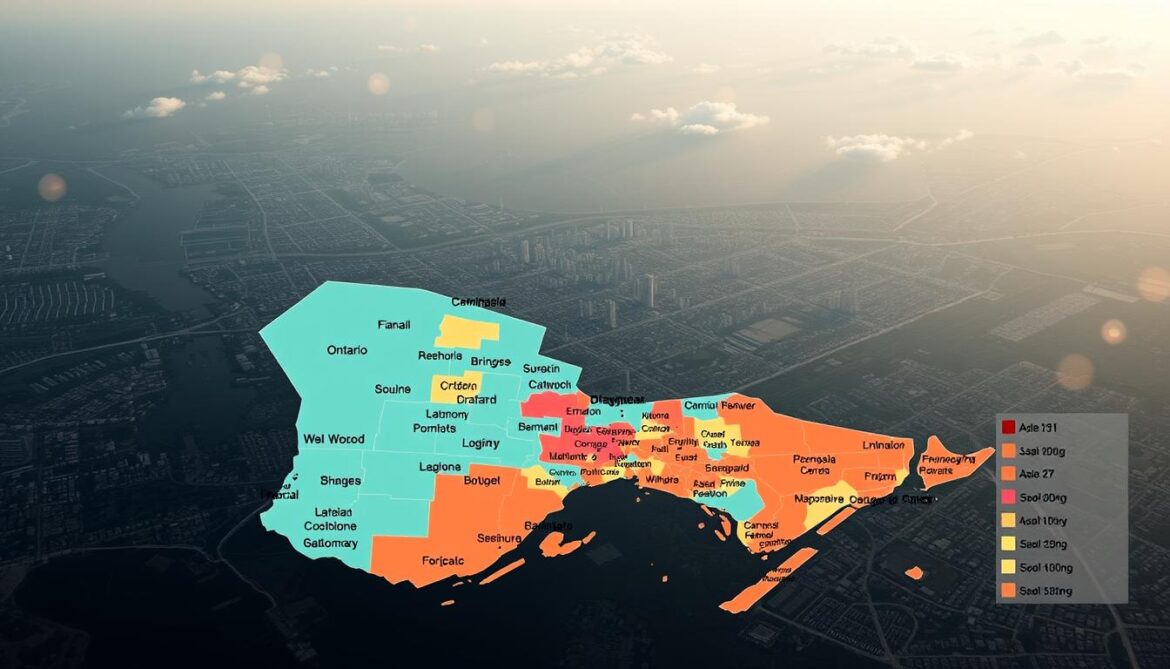
Did you know 1 in 17 Canadians experienced a police-reported crime incident in 2023? With 5,843 incidents per 100,000 people nationally, safety varies dramatically between regions. While rural areas face higher crime severity, urban centers grapple with unique pressures that reshape community safety.
This analysis reveals how socioeconomic factors and population density create stark contrasts. For example, Saskatchewan’s crime severity index soared 60% higher than Prince Edward Island’s last year. Even within provinces, cities differ widely – a pattern seen clearly when comparing crime severity index data across Canada.
You’ll discover why some areas report double the national average for violent offenses. Housing shortages in fast-growing regions correlate strongly with theft rates, while fraud cases surged 50% nationwide since 2018. These trends highlight why understanding local crime statistics matters for residents and visitors alike.
Ontario’s urban zones face specific challenges despite lower overall rates. Through verified police reports and weighted severity metrics, we’ll unpack what makes certain locations risk hotspots – and how communities are responding.
Canada’s Crime Overview
Canada’s safety profile stands out globally, with police-reported incidents affecting just 5.8% of residents in 2023. While the national crime rate rose slightly to 5,843 incidents per 100,000 people, this remains lower than many industrialized nations. Urban centers, however, tell a more complex story.

National Crime Rates per 100,000 People
Last year’s three-per-cent increase in overall incidents masks critical regional differences. Quebec City’s crime index of 22.2 contrasts sharply with areas like Northwest Territories, where rates triple the national average. The Crime Severity Index reveals hidden patterns:
“A single armed robbery impacts community safety more than ten minor thefts – that’s why CSI weights offenses by their societal harm.”
Overview of Urban Crime Severity
Metropolitan areas face unique pressures. Break-ins and vehicle theft surged 18% in fast-growing regions last year. Dense populations create opportunities for property crimes, while economic disparities often correlate with violent offenses.
Police data shows assaults increased 7% in transit hubs but decreased 3% in residential neighborhoods. This split highlights how crime patterns shift with urban design and policing strategies.
Understanding the Most Dangerous Cities in Ontario
Recent data reveals striking contrasts in community safety across Ontario’s urban centers. Greater Sudbury tops regional charts with a Crime Index of 61.9, where violent offenses accounted for 67% of all reported incidents last year. Hamilton follows closely, documenting 4,700 assaults and robberies alongside 10,500 property-related cases in 2023.
Emerging Patterns in Criminal Activity
Brampton’s debut on safety watchlists highlights shifting dynamics. Peel police reported 9,100 criminal occurrences per 100,000 residents – a 14% increase from 2022 figures. Meanwhile, Sault Ste. Marie’s 6,800 Criminal Code violations per capita underscore persistent challenges in smaller municipalities.
These trends align with broader violent crime trends affecting Canadian urban areas. London’s 8,900 annual incidents and Sudbury’s two-to-one violent/non-violent crime ratio demonstrate how localized factors reshape risk profiles. Proactive policing and community programs now prioritize reducing repeat offenses in high-index zones.

