Did you know certain neighborhoods in Canada’s largest urban centers have seen a 30% shift in safety metrics over the past five years? Understanding these trends isn’t just about numbers—it’s about making informed decisions for your family, business, or travels. This guide unlocks local insights you won’t find anywhere else.
At CanadaCrime.ca, we simplify complex data like the crime severity index, a tool that measures both frequency and seriousness of incidents. Whether you’re researching Toronto’s downtown core or Montréal’s suburban zones, our platform offers interactive maps and year-over-year comparisons. You’ll see how police-reported incidents vary across regions and what drives these changes.
Why does this matter? The index helps identify areas where improvements are happening—or where challenges persist. For example, some cities report lower violent activity but higher property-related issues. Our analysis, backed by Statistics Canada and provincial databases, ensures accuracy without bias.
Key Takeaways
- The crime severity index measures both frequency and impact of incidents, offering a clearer picture than raw numbers alone.
- Compare trends in major urban areas like Toronto and Montréal using verified, up-to-date metrics.
- Access interactive tools on CanadaCrime.ca to explore data tailored to your specific interests.
- Learn how local policies and community initiatives influence year-to-year changes in safety levels.
- Identify neighborhoods with improving conditions or emerging challenges through detailed regional breakdowns.
Understanding Crime Severity Index and Its Impact
To truly grasp safety trends, you need more than just numbers—you need context. The Crime Severity Index (CSI) measures both how often incidents occur and their societal impact. Unlike basic counts, it weighs offenses based on their seriousness, offering a clearer view of risk levels in your area.
How the CSI Is Calculated and Its Components
Every offense in the CSI receives a weight reflecting its average sentencing data. For example, violent acts like robbery carry heavier weights than minor property violations. The index includes all police-reported data from the Criminal Code, excluding traffic violations, ensuring consistency across regions.

Interpreting the Seriousness of Various Offences
A single assault affects the CSI more than multiple thefts due to its higher weight. This approach reveals whether an area struggles with frequent minor issues or rare but severe events. For instance, Statistics Canada data shows urban zones often have higher severity scores despite lower overall incident counts.
By focusing on weighted values, the CSI helps you compare neighborhoods fairly. Tools on CanadaCrime.ca simplify these insights, letting you spot trends like rising property issues or declining violent activity. This clarity supports smarter decisions—whether choosing a home or evaluating local policies.
crime statistics by city canada
Major metropolitan zones show striking contrasts in safety patterns. Toronto’s downtown core saw a 12% drop in violent incidents since 2022, while suburban Mississauga reported higher property-related issues. Montréal’s Plateau neighborhood bucked national trends with a 9% improvement in overall safety scores.

Key Trends Revealed by Recent Data
Urban centers now face evolving challenges. Vancouver’s severity index rose 6% last year due to increased thefts, contrasting with Winnipeg’s 8% decline in high-impact offenses. Police-reported figures highlight how commercial districts often bear heavier weights in calculations than residential zones.
Three patterns stand out:
- Coastal cities show sharper seasonal fluctuations
- Mid-sized urban areas outperform larger metros in violent offense reductions
- Suburban regions struggle with consistent year-round incident tracking
Comparative Analysis Across Major Cities
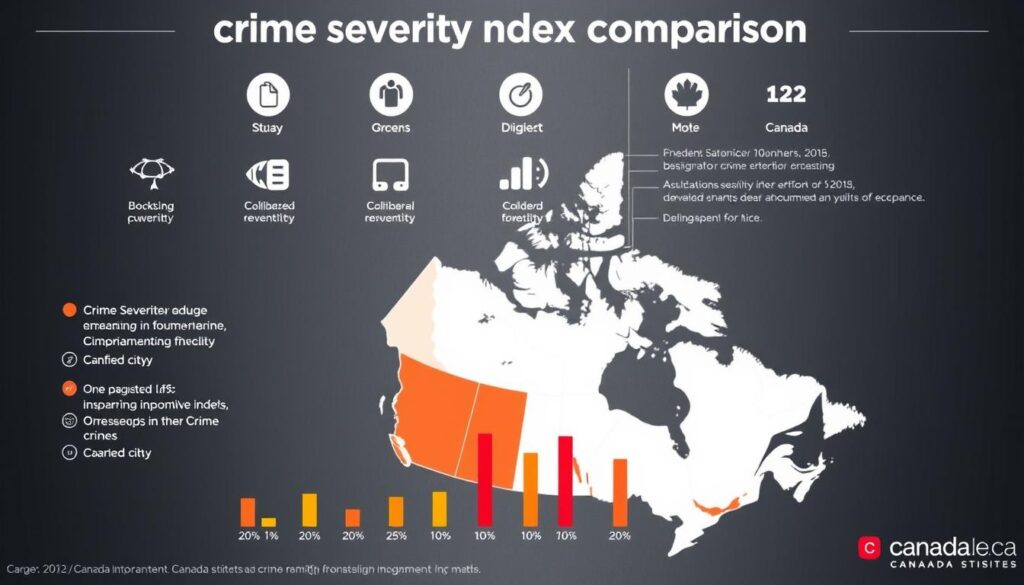
Toronto’s severity score sits 18% below Calgary’s despite similar population density. Montréal leads in property crime reductions but trails in resolving cyber-related offenses. Our interactive tools at CanadaCrime.ca let you contrast these metrics side-by-side.
“Safety isn’t just about numbers—it’s about understanding what those numbers represent for different communities.”
Data reveals Ottawa’s prioritization of community policing correlates with lower index weights for violent acts. Explore neighborhood-level insights through our platform’s heatmaps, updated quarterly with Statistics Canada inputs.
Regional Crime Trends and Notable Cities
Diving into regional data uncovers hidden trends shaping neighborhood safety. CanadaCrime.ca’s analysis reveals how localized factors like population density and economic activity influence security outcomes. Let’s explore patterns in two major hubs and their surrounding communities.

Insights from the Greater Toronto Area and Montréal
The Greater Toronto Area (GTA), home to over 6.2 million residents, saw its severity index jump 10.8% last year. Downtown Toronto’s 17.2% spike in property-related incidents contrasts with a 1.6% decline in violent offenses. Montréal’s Plateau district bucked this trend, achieving a 9% improvement in safety metrics through targeted community programs.
Urban Versus Suburban Crime Patterns
Densely populated zones face unique challenges. The GTA’s urban core reports three times more thefts per capita than suburban Mississauga. However, suburban areas struggle with consistent tracking of non-violent incidents. Our tools at CanadaCrime.ca show:
- Public transit hubs influence urban severity scores
- Suburban growth corridors see faster-rising index values
- Mixed-use neighborhoods achieve more balanced safety profiles
These variations highlight why localized strategies matter. A 5% shift in an area’s severity index could signal emerging risks or successful interventions. Explore interactive maps on our platform to see how your community compares.
Top Crime Data Products on CanadaCrime.ca
Transform how you analyze public safety with precision tools designed for clarity and speed. Our platform’s curated resources turn complex datasets into actionable insights, whether you’re evaluating neighborhood trends or regional patterns.

Overview of Featured Tools and Resources
Interactive dashboards let you filter results by location type—from provinces to postal codes. The Comparative Analytics Suite reveals hidden connections between economic factors and safety metrics. Real-time updates ensure you’re working with the latest police-reported figures.
First-time users appreciate guided tutorials, while experts leverage advanced filtering. One standout feature: side-by-severity index comparisons across multiple regions. This helps identify outliers like urban zones with unusually low violent offense rates despite high population density.
Product Roundup: Benefits for Your Research
The Police-reported Information Hub slashes hours off data collection. Create custom reports showing year-over-year changes in property incidents or cyber-related offenses. Export results instantly for presentations or policy proposals.
Verified information from official sources powers every tool. As one municipal planner noted: “These dashboards transformed how we allocate community safety resources.” Whether tracking severity trends or benchmarking neighborhoods, our products deliver certified accuracy without technical jargon.
Leveraging Online Platforms for Comprehensive Crime Data
Want to uncover safety patterns in your community? Modern tools transform how you explore public safety metrics. Our platform simplifies access to critical insights through intuitive design and dynamic filters.

Navigation Made Simple
CanadaCrime.ca’s interface lets you pinpoint information in three clicks. Use the timeline slider to compare severity index values across years or toggle between regions like Halifax and Hamilton. Real-time maps highlight hotspots while minimizing clutter.
Tailored Research Solutions
Customize searches using multiple parameters:
- Select specific offense types or police-reported categories
- Generate side-by-side comparisons of urban vs. rural areas
- Export visual charts showing monthly rate fluctuations
One user recently tracked property-related incidents in their postal code over five years. They discovered a 14% decline linked to neighborhood watch programs. Our tools make these connections visible through layered data visualization.
Whether you’re assessing school district safety or business location risks, the platform adapts to your needs. Dynamic reports update automatically, ensuring you always work with fresh information. As one security analyst noted: “This clarity helps us allocate resources where they matter most.”
Conclusion
Navigating urban safety isn’t guesswork when backed by reliable metrics. The crime severity index remains essential for distinguishing between frequent minor issues and high-impact events. Through CanadaCrime.ca, you gain access to verified insights that shape smarter choices—whether evaluating neighborhoods or assessing policy outcomes.
Our analysis shows how regions like Toronto’s core and Montréal’s suburbs follow distinct safety trajectories. Interactive tools simplify comparing these patterns, revealing whether police-reported trends stem from property concerns or rarer violent acts. This clarity transforms raw numbers into actionable strategies.
Trustworthy data forms the foundation of every insight. By combining official sources with intuitive visualizations, our platform helps you track progress or identify emerging risks. Explore updated heatmaps and severity comparisons to stay informed about your community’s evolving profile.
Ready to dive deeper? Visit CanadaCrime.ca today for tools that turn complex metrics into clear next steps. Your journey toward data-driven safety decisions starts here.

