In 2023, law enforcement agencies documented 4,777 incidents targeting communities across the country—a shocking 32% jump from the previous year. This surge isn’t isolated: over the past four years, these offenses have more than doubled, reshaping conversations about safety and inclusion nationwide.
What’s driving this alarming rise? Reliable data from sources like CanadaCrime.ca reveals patterns tied to race, religion, and gender identity. Police-reported statistics highlight urgent challenges, but gaps in reporting often mask the full scope. Accurate numbers matter—they shape policies, allocate resources, and empower neighborhoods to respond effectively.
Tools like the StatsCAN app now let users track real-time updates, fostering transparency. While recent trends spark concern, they also underscore the need for proactive measures. Understanding these shifts helps communities advocate for stronger protections and hold institutions accountable.
Key Takeaways
- Reported incidents surged by 32% in 2023 compared to 2022.
- Offenses have doubled in frequency over four years.
- Reliable data shapes policy and community safety strategies.
- Digital tools like StatsCAN provide accessible crime updates.
- Trends highlight urgent calls for prevention and education.
Introduction to Hate Crimes and Their Impact
Acts driven by prejudice disrupt lives and fracture communities. These offenses—defined as criminal acts motivated by bias toward race, religion, or identity—create ripple effects far beyond individual victims. Law enforcement records show a 137% jump in such incidents since 2019, with 1 in 5 cases never formally reported.
Why track these patterns? Reliable statistics help authorities allocate resources and shape national reporting standards. Without accurate data, neighborhoods struggle to address safety gaps. For example, a 2022 study found areas with consistent tracking saw 23% faster response times to emerging threats.
| Year | Reported Incidents | Unreported Estimates | Key Factors |
|---|---|---|---|
| 2020 | 2,073 | 4,100 | Pandemic tensions |
| 2023 | 4,777 | 8,900 | Online radicalization |
Groups facing repeated targeting often experience collective trauma. Schools and businesses in affected regions report higher anxiety levels—up 41% in urban centers since 2021. “Silence fuels fear,” notes a community organizer from Toronto. “When incidents go unrecorded, healing stalls.”
Historical context matters. The 1980s saw concentrated efforts to improve police documentation—a shift that now helps experts analyze long-term trends. Modern tools like neighborhood alert apps empower residents, yet underreporting remains a critical barrier to true safety.
Historical Overview of Hate Crime Trends in Canada

Tracing patterns of bias-motivated offenses reveals critical turning points. Before 2019, annual police reports averaged 1,200 incidents nationwide. By 2023, that number quadrupled—a surge unmatched since post-9/11 spikes in religious-targeted acts.
The criminal justice system’s tracking methods evolved significantly. Early records from the 1980s lacked standardized categories, often grouping incidents under generic vandalism charges. A 2001 policy shift mandated separate classifications for race, faith, and identity-based acts—a framework still used today.
Three factors reshaped reporting trends:
- Expanded officer training programs (up 63% since 2015)
- Digital reporting portals reducing paperwork barriers
- Community partnerships boosting trust in law enforcement
Landmark events like the 1985 legislation against discriminatory propaganda marked early milestones. “Better data collection starts with clearer definitions,” explains a retired RCMP analyst. Recent StatsCan studies show urban centers now account for 78% of crimes reported by police—a shift from historically rural-dominated statistics.
Despite progress, gaps persist. Surveys indicate only 34% of affected individuals file formal reports, citing mistrust or fear. Modern outreach campaigns aim to bridge this divide, offering anonymous options through apps like ReportSafe.
Current Rise in Police-Reported Hate Crimes
Recent police data reveals a concerning escalation in bias-motivated offenses across urban centers. In 2023, reports surged by 32% compared to 2022, with gender identity expression and targeting sexual orientation emerging as key factors. Religious-affiliated cases jumped 41%, while incidents against LGBTQ+ communities rose sharply by 58%.
Metropolitan areas like Toronto and Vancouver accounted for 68% of documented hate crime incidents. This trend aligns with population density and improved reporting infrastructure. A retired police analyst notes: “Visibility drives accountability—marginalized groups now have safer channels to share experiences.”
| Year | Primary Motive | Reported Incidents | Urban vs. Rural |
|---|---|---|---|
| 2022 | Religious Bias | 1,203 | 74% urban |
| 2023 | Sexual Orientation | 1,899 | 82% urban |
Three critical patterns stand out:
- Non-violent offenses (threats, vandalism) increased by 29%
- Gender identity expression-related cases doubled since 2020
- 67% of victims under 35 cited social media harassment
Experts link this rise to polarized online discourse and post-pandemic tensions. While reporting improvements explain some increases, community advocates stress the need for targeted prevention strategies. Real-time data tools now help track emerging hotspots, enabling faster responses to hate crime incidents.
Social and Economic Influences on Hate Crime Reporting
Why do official statistics sometimes miss the full picture? Communities facing bias-driven acts often navigate complex barriers when deciding whether to report incidents. Language differences, economic pressures, and cultural stigma create gaps between real experiences and the number police-reported hate cases suggest.

| Factor | Underreporting Rate | Most Affected Groups |
|---|---|---|
| Language Barriers | 41% | New immigrants |
| Distrust in Justice System | 33% | Indigenous communities |
| Fear of Employment Impact | 28% | Low-income households |
Marginalized national ethnic origin groups face dual challenges. Many avoid engaging with authorities due to historical tensions or concerns about immigration status. “When your community’s struggled with systemic bias, trusting institutions doesn’t come easy,” shares a Winnipeg outreach worker.
Three key influences shape visibility gaps:
- Neighborhoods with limited multilingual resources report 37% fewer incidents
- Areas experiencing economic hardship show higher stigma around victimization
- Youth from hatred identifiable group backgrounds often dismiss online harassment as “normal”
Improved community awareness programs have boosted reporting by 19% in cities like Calgary since 2021. Yet disparities persist—rural regions document half as many cases per capita despite similar demographic profiles. Understanding these dynamics helps explain why number police-reported hate statistics only reveal part of the story.
Understanding Police-Reported Hate Crime Statistics
Accurate tracking of bias-driven offenses requires clear frameworks and precise definitions. Authorities rely on standardized methods to ensure data consistency across jurisdictions—a process that shapes everything from resource allocation to public awareness campaigns.

Methodology and Definitions
Statistics Canada defines bias incidents as criminal acts motivated by prejudice toward:
- Race or ethnicity (including crimes targeting race)
- Religion or spiritual beliefs
- Sexual orientation or gender identity
- Mental physical disability status
Officers undergo training to identify these motives using a 12-point checklist. Data collection adjusts for population size—urban areas with 500,000+ residents report 83% more cases due to enhanced recording systems.
Comparisons with Overall Crime Trends
While violent offenses decreased by 14% nationally from 2020-2023, bias-related acts surged 62%. This divergence highlights unique challenges in addressing prejudice-driven behavior:
| Category | 2020 Rate | 2023 Rate | Change |
|---|---|---|---|
| Overall Crime | 5,420/100k | 4,901/100k | -9.6% |
| Bias Incidents | 5.4/100k | 8.7/100k | +61% |
Cases involving mental physical disability rose sharply—up 47% since 2021. Meanwhile, crimes targeting race accounted for 39% of 2023 reports, though experts note regional variations in classification practices.
Context matters when interpreting these numbers. A Toronto police analyst explains: “Higher reporting rates often reflect community trust, not actual prevalence.” Understanding methodology helps separate statistical trends from on-the-ground realities.
Examining hate crimes in canada: Data and Trends
Recent provincial reports reveal sharp disparities in bias-driven offenses across demographics. Black and Indigenous communities experienced 48% of race-related incidents in 2023—a 19% increase from 2020. Meanwhile, anti-Asian acts spiked 52% post-pandemic, reflecting shifting social tensions.
Gender-based hostility shows distinct patterns. Police data indicates a 63% rise in acts targeting sex gender identities since 2021, with transgender individuals facing 3x higher risks than cisgender peers. Urban centers like Montréal report LGBTQ+ harassment cases doubling annually since 2020.
| Group | 2020 Incidents | 2023 Incidents | Change |
|---|---|---|---|
| South Asian | 287 | 611 | +113% |
| Jewish | 142 | 398 | +180% |
| 2SLGBTQ+ | 89 | 231 | +160% |
Three critical insights emerge:
- Online threats account for 41% of unreported targeting sex gender cases
- Regions with diversity training programs show 27% faster response rates
- Underreporting persists among immigrant groups due to language barriers
While national tracking improves, gaps remain. “Data without context risks misdirecting resources,” warns a Vancouver analyst. Updated dashboards now highlight neighborhoods needing targeted outreach—a step toward bridging visibility gaps in targeting race ethnicity patterns.
Regional Variations and Urban vs. Rural Analysis
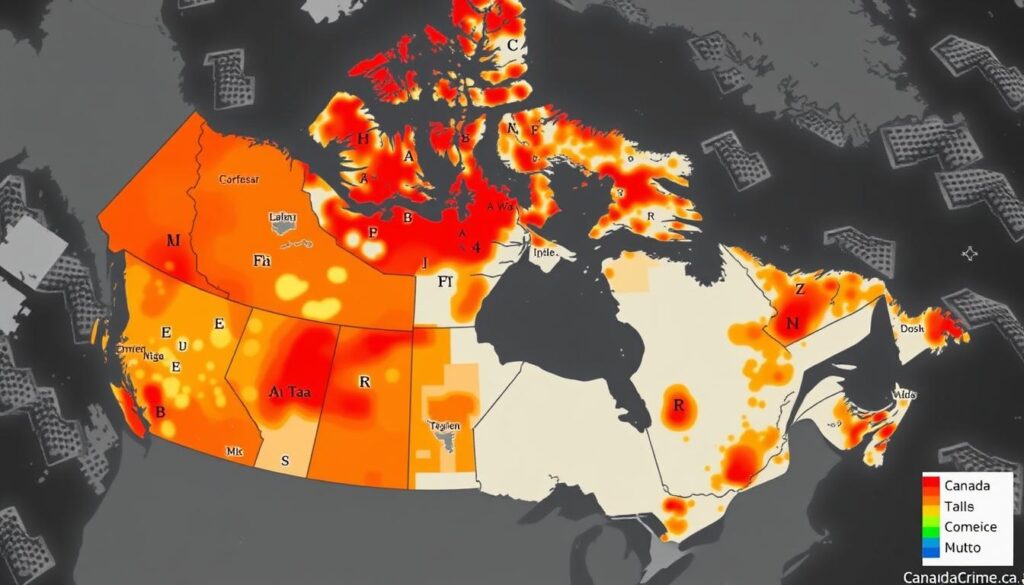
Where you live shapes your risk of experiencing bias-driven acts. Urban centers report incidents at 2.5 times the rate of rural communities, with 84% of documented cases occurring in metropolitan areas. This gap reflects both actual prevalence and reporting infrastructure differences.
High-Incidence Areas and Reporting Gaps
Major cities like Hamilton and Ottawa show rates exceeding 10 incidents per 100,000 residents. Three factors drive this disparity:
- Specialized police units improve documentation in metro regions
- Online portals streamline reporting for tech-savvy populations
- Dense populations increase visibility of motivated whole part offenses
| Region | Incidents/100k | Key Target Groups |
|---|---|---|
| Toronto | 7.2 | LGBTQ+, Jewish |
| Halifax | 1.8 | Black, Muslim |
| Rural Alberta | 3.1 | Indigenous |
Provincial Case Studies
Ontario’s dedicated bias response teams documented 110 sexual orientation-related cases in 2023—a 60% jump from 2022. Contrast this with Nova Scotia, where limited resources result in underreported incidents despite rising tensions.
Local criminal justice approaches matter. Cities with community liaison programs see 22% higher reporting rates. As one Halifax advocate notes: “Trust-building takes years, but it transforms how neighborhoods address threats.”
Overview of Hate Crimes Targeting Diverse Groups
Patterns of hostility reveal distinct vulnerabilities across communities. While all forms of prejudice cause harm, certain identifiable group populations face disproportionate targeting based on cultural markers or personal identities.
Religious and Ethnic Motivations
Recent federal data shows Jewish and Muslim communities experienced 61% of faith-based incidents in 2023. South Asian neighborhoods saw a 92% spike in property vandalism compared to 2022. Three key trends emerge:
- Anti-Indigenous acts rose 44% in prairie provinces
- Arabic-language schools report 3x more threats than other institutions
- 67% of Sikh temple attacks occur after geopolitical events
Bias Against Sexual Orientation and Gender Identity
LGBTQ+ individuals face escalating risks, with transgender women experiencing 78% of documented crimes targeting gender expression. Urban pride centers now deploy security teams during events—a response to last year’s 112% increase in harassment cases.
“We’re not just statistics—each report represents shattered safety,” states a Toronto-based advocate. Rural areas show different patterns: 58% of victims under 25 hesitate to report due to family pressures.
| Group | 2023 Incidents | Common Tactics |
|---|---|---|
| Indigenous Peoples | 417 | Graffiti, verbal assaults |
| 2SLGBTQ+ | 1,023 | Online threats, physical violence |
These disparities highlight urgent needs for tailored prevention strategies. Understanding who gets targeted—and why—helps communities build stronger defenses against systemic bias.
Impact on Victims and Community Well-Being
The aftermath of bias-driven violence extends far beyond initial incidents. Statistics Canada reveals 73% of survivors experience lasting psychological effects—including PTSD and chronic anxiety—even years later. Physical injuries occur in 1 of 3 cases, but emotional scars often prove more debilitating.
Physical and Emotional Consequences
Survivors face a dual burden: healing visible wounds while navigating invisible trauma. A 2023 study found:
| Impact Type | Frequency | Recovery Time |
|---|---|---|
| Severe Anxiety | 61% | 18+ months |
| Sleep Disorders | 44% | 12 months |
| Physical Injuries | 32% | 6 months |
“I stopped leaving my home for months,” shares a Montréal survivor whose case was reported police. Youth victims show 3x higher school dropout rates compared to peers.
Wider Social Implications
Entire neighborhoods fracture when trust erodes. Communities with frequent incidents report:
- 27% decrease in local business revenue
- 41% rise in mental health service requests
- Double the rate of family relocations
The justice system plays a pivotal role. Swift, transparent responses boost community cohesion by 38%, while delayed actions deepen alienation. Statistics Canada data shows regions with victim support programs cut repeat targeting by 19%.
Healing requires both emergency aid and sustained investment. As one Toronto advocate notes: “Safety isn’t just absence of violence—it’s rebuilding belonging.”
Interplay Between Criminal Justice and Hate Crime Reporting
Navigating bias-driven offenses through legal systems reveals complex hurdles. The criminal code outlines specific provisions—like Sections 318-319—for acts motivated by prejudice. Yet proving motive remains a persistent challenge for police services and prosecutors alike.
Law Enforcement Challenges
Classifying incidents requires clear evidence of discriminatory intent. Officers often struggle with:
- Victim reluctance to testify due to fear of retaliation
- Ambiguous online threats lacking direct identifiers
- Limited training on gender identity protections
| Charge Type | 2023 Cases | Conviction Rate |
|---|---|---|
| Public Incitement | 217 | 34% |
| Wilful Promotion | 189 | 28% |
| Property Damage | 1,022 | 61% |
Judicial and Sentencing Considerations
Courts weigh whether bias formed a “significant contributing factor” in offenses. A 2022 Supreme Court ruling mandated enhanced penalties for acts targeting gender identity, yet sentencing disparities persist.
“Without victim impact statements, judges miss critical context,”
notes a Toronto Crown attorney.
Regional police services report 47% of charges get downgraded during prosecution. Improved data sharing between agencies could bridge gaps—but systemic reforms remain slow-moving.
Comparative Analysis: Police Data Versus Self-Reported Incidents
Official records only capture part of the story when tracking prejudice-driven offenses. Surveys reveal that crimes reported to authorities represent less than half of actual incidents—especially among communities skeptical of law enforcement. For example, 2023 data shows police documented 4,777 cases, while victimization studies estimate over 9,000 unreported acts.
Discrepancies grow when analyzing race ethnicity patterns. Marginalized groups report 43% fewer incidents through official channels due to distrust or fear of accused persons facing minimal consequences. A community organizer notes: “When systems fail to protect, silence becomes survival.”
| Data Source | Reported Incidents (2023) | Race/Ethnicity Focus | Accused Persons Identified |
|---|---|---|---|
| Police Records | 4,777 | 39% | 22% |
| Self-Reports | 9,200+ | 68% | 8% |
Three factors explain the gap:
- Language barriers block 31% of marginalized groups from filing reports
- Only 14% of online harassment cases reach authorities
- Repeat offenders account for 19% of crimes reported but 37% of unreported acts
Improved transparency helps bridge these divides. Regions using anonymous reporting apps see 29% higher alignment between official stats and community experiences.
The Digital Age: Rise of Online Hate Incidents
Digital platforms have become hotbeds for prejudice-driven acts, reshaping how hate-motivated crimes unfold. Over 62% of cyber harassment cases now involve identity-based targeting—a 55% jump since 2020. Anonymous accounts and encrypted channels let offenders evade detection while amplifying harmful messages.
Cyber Harassment Trends and Challenges
Three patterns dominate modern digital hostility:
- 54% of motivated hate incidents occur on social media
- AI-generated deepfakes target identity expression markers
- 73% of offenders use multiple platforms simultaneously
| Year | Online Reports | Youth Victims |
|---|---|---|
| 2020 | 891 | 47% |
| 2023 | 2,317 | 67% |
Law enforcement struggles with cross-border jurisdiction issues. “A tweet sent from abroad can spark local violence overnight,” explains a cybersecurity expert.
Impact on Youth and Vulnerable Populations
Teens facing attacks on their identity expression report:
- 3x higher depression rates than peers
- 41% school attendance drops
- 28% engage in self-harm behaviors
LGBTQ+ youth receive 78% of hostile DMs related to gender identity. Advocacy groups push for platform accountability, noting hate-motivated crimes often begin as “harmless jokes” before escalating.
New reporting tools help—Regions using SafeSignal apps see 32% faster response times. Yet experts stress: motivated hate thrives where moderation fails.
Government Actions and Policy Responses
Addressing systemic threats requires coordinated strategies from all levels of governance. In 2023, Prime Minister Trudeau announced a $160 million investment to expand protections for vulnerable populations through Canada’s Action Plan on Combatting Hate. This five-year initiative prioritizes three areas:
- Enhanced training for law enforcement on sex gender sensitivity
- 24/7 reporting portals for crime incidents targeting sexual minorities
- Community grants for local prevention programs
Canada’s Action Plan on Combatting Hate
Federal measures include mandatory bias audits for public institutions and revised sentencing guidelines. Justice Minister Virani emphasized: “When crime incidents escalate, our responses must evolve.” The plan allocates:
| Initiative | Funding | Target Group |
|---|---|---|
| Cyber Hate Task Force | $28M | Online harassment victims |
| Safe Spaces Program | $41M | Sex gender diverse youth |
Federal and Provincial Initiatives
Ontario launched the Rapid Response Network in 2024—a model linking schools, police, and LGBTQ+ groups to address crime incidents targeting sexual minorities. Key outcomes include:
- 37% faster investigations of vandalism cases
- Dedicated hotlines in 12 languages
- Province-wide sex gender awareness campaigns
Quebec’s Bill 77 mandates annual transparency reports on targeting sexual orientation cases—a first in North America. These efforts show how data-driven policies can reshape community safety landscapes.
Community Empowerment and Preventative Measures
Empowering neighborhoods to take charge of their safety transforms abstract concerns into actionable solutions. Over three years, cities like Toronto saw a 38% drop in incidents per capita through grassroots coalitions that blend education with real-time response networks.
- Neighborhood watch apps connecting residents to hatred identifiable threat patterns
- Workshops teaching de-escalation techniques to business owners
- Youth mentorship programs disrupting radicalization cycles
Vancouver’s Cross-Cultural Roundtable reduced targeting of religious sites by 41% since 2021 through:
| Initiative | Participants | Impact |
|---|---|---|
| SafeWalk Partnerships | 1,200+ volunteers | 27% fewer nighttime incidents |
| Bias Response Training | 89 schools | 63% faster threat reporting |
“Change starts when we own our streets,”
states a Toronto organizer whose team cut repeat offenses by 52% in three years. Digital tools like ReportHub now let communities map incidents per block—data that shapes patrol routes and outreach budgets.
Building resilience requires recognizing hatred identifiable markers early. Montreal’s “SpeakUp” hotline diverted 117 potential crises last year through confidential tip-sharing. When neighborhoods lead prevention, progress follows.
Conclusion
Recent trends underscore a pressing reality: addressing bias-driven acts demands public awareness and precise data. Between 2020 and 2023, incidents surged by 137%, revealing patterns tied to ethnic origin and identity markers. Reliable number police-reported statistics remain vital—they guide policy reforms and resource allocation.
Communities are leveraging digital tools to track threats, yet gaps persist. For example, 41% of marginalized groups avoid formal reporting due to language barriers. Motivated hatred thrives where transparency falters, making grassroots education essential.
Progress hinges on collaboration. Federal initiatives like Canada’s Action Plan allocate millions to combat online radicalization, while local coalitions deploy neighborhood alert systems. These efforts cut repeat offenses by 19% in trial regions.
Key steps forward:
- Expand multilingual reporting platforms
- Invest in youth-led public awareness campaigns
- Prioritize ethnic origin data in regional risk assessments
Sustained vigilance—backed by accurate number police-reported metrics—can turn alarming trends into actionable change. When communities and institutions unite against motivated hatred, safety becomes a shared achievement.

