Did you know that one region’s Crime Severity Index (CSI) recently measured over 470 points – nearly triple the national average? This stark contrast highlights how safety dynamics vary dramatically across communities. Tracking these patterns isn’t just about numbers – it’s about understanding what they mean for neighborhoods, families, and policy decisions.
The CSI goes beyond traditional metrics by weighing offenses based on their societal impact. For example, violent acts like assaults influence this index more heavily than property-related incidents. This approach reveals whether communities face frequent minor issues or rarer but more severe threats.
Platforms like canadacrime.ca and My StatCan updates provide accessible tools to explore these insights. You’ll find interactive maps showing how urban centers compare to rural areas, or why certain provinces maintain lower severity scores year after year.
In later sections, we’ll break down how law enforcement strategies correlate with CSI fluctuations and examine why some regions see persistent challenges. You’ll also discover how combining volume data with severity analysis creates a clearer picture of safety progress.
Key Takeaways
- The Crime Severity Index measures both incident frequency and societal impact
- Violent offenses affect regional scores more significantly than property crimes
- Data visualization tools make complex trends understandable
- Localized analysis helps identify community-specific challenges
- Historical comparisons reveal effectiveness of policy changes
Introduction to Canadian Crime Trends
Understanding shifts in community safety requires looking beyond headlines. Recent reports show over 5,800 incidents per 100,000 people occurred nationally in 2023. This number reflects both minor violations and serious threats, tracked through standardized methods by agencies like Statistics Canada.

Overview of the Current Landscape
Violent offenses accounted for nearly 20% of all reported cases last year, while non-violent acts like theft dominated the remaining share. Tools like canadacrime.ca simplify this data through interactive dashboards. You’ll notice urban centers often report higher incident volumes compared to rural zones.
Youth-related incidents remain a critical focus area. Tracking frameworks measure factors like:
- Age-specific offense patterns
- Recidivism rates among minors
- Community intervention outcomes
Purpose of This Trend Analysis
These metrics help you grasp how enforcement priorities align with real-world challenges. For example, regions investing in youth mentorship programs often see lower repeat offense rates. Platforms updating in real-time let you spot emerging patterns before they escalate.
By contextualizing raw numbers, you gain insights into prevention strategies and resource allocation. This clarity transforms abstract statistics into actionable knowledge for households and policymakers alike.
Deep Dive into stats canada crime rates
How do experts quantify safety challenges across diverse communities? The answer lies in standardized formulas that adjust for population density and incident gravity. Let’s unpack the math behind the numbers.

Understanding the Key Metrics
Crime rates per 100,000 residents act as an equalizer. This calculation divides total incidents by local inhabitants, then multiplies by 100,000. For example, a town with 50 thefts and 10,000 people would show a 500-rate – five times higher than a city with 200 thefts and 400,000 residents.
Consider this comparison of 2023 data:
| Crime Type | Weight in CSI | 2023 Rate per 100k |
|---|---|---|
| Homicide | 7.5x | 2.25 |
| Assault | 3.2x | 487 |
| Burglary | 1.0x | 612 |
Homicide’s heavy weighting explains why regions with rare but severe cases show elevated severity scores. Since 1999, these incidents have fluctuated between 1.8 and 2.4 per 100k, peaking in 2023. Yet urban centers often report higher raw numbers due to concentrated populations.
“Standardized metrics let us compare apples to apples – a rural village’s 10 assaults carry different weight than a metropolis’s 1,000.”
Geographic variations matter too. Northern territories consistently show rates triple the national average, partly due to smaller area populations amplifying individual cases. Tools like StatCan’s regional dashboards reveal these nuances through adjustable filters.
Unpacking the Crime Severity Index in Canada
Many assume crime tracking focuses solely on quantity. The truth? The Crime Severity Index (CSI) measures both how often offenses occur and their real-world consequences. This dual approach transforms raw numbers into actionable insights about community safety.

How Experts Calculate the CSI
Officials determine CSI scores through a weighted formula. Each offense type receives a value based on:
- Average prison sentences for convicted individuals
- Actual incarceration rates for specific crimes
- Police-reported incident frequency
For example, armed robberies carry heavier weights than shoplifting cases. This system prioritizes acts causing greater societal harm. Law enforcement data from across the nation feeds into these calculations annually.
Why This Measurement Affects You
The CSI reveals what traditional counts miss. A community with 100 petty thefts scores lower than one with 50 assaults.
“Weighted metrics help communities allocate resources where they’ll make the biggest safety impact.”
Youth-related incidents receive special attention. Offenses involving minors are tracked separately, highlighting prevention opportunities. When CSI trends shift, you’ll see whether challenges stem from serious violent acts or recurring minor violations.
Policymakers use these insights to tailor intervention strategies. Neighborhood watch groups analyze local scores to identify priority areas. By understanding both volume and severity, you gain a clearer picture of safety progress in your region.
Shifting Trends in Violent and Property Crime
What happens when break-ins decline but assaults rise? Recent patterns reveal a split-screen reality: property offenses dropped 13% since 2019, while violent acts like homicides climbed 7% per 100,000 people. This divergence reshapes how communities experience safety.

Insights into Violent Crime Severity
Urban centers saw homicides jump to 2.25 incidents per 100,000 residents in 2023 – the highest rate in 20 years. Three factors drive this shift:
- Increased gang-related activity in metro areas
- Economic pressures from housing affordability crises
- Changing law enforcement priorities post-pandemic
Manitoba’s violent crime rate per 100,000 people (10,599) nearly triples Quebec’s figures, showing stark regional contrasts. Socioeconomic strains amplify these gaps – areas with limited social services often report higher severity scores.
Understanding Property Crime Patterns
While burglaries decreased nationally, cyber-enabled fraud now accounts for 38% of property-related cases. The table below highlights key changes:
| Offense Type | 2020 Rate | 2023 Rate |
|---|---|---|
| Residential Break-ins | 612 | 529 |
| Vehicle Thefts | 287 | 411 |
| Online Fraud | 154 | 583 |
Public perception lags behind these shifts. Many still view home invasions as the primary threat, despite digital crimes affecting 1 in 4 households. Official police-reported data helps bridge this awareness gap through real-time updates.
To stay informed, cross-reference local severity indexes with economic indicators. Areas combining high unemployment and rising rents often see simultaneous drops in physical thefts and surges in violent confrontations.
Provincial and Demographic Insights
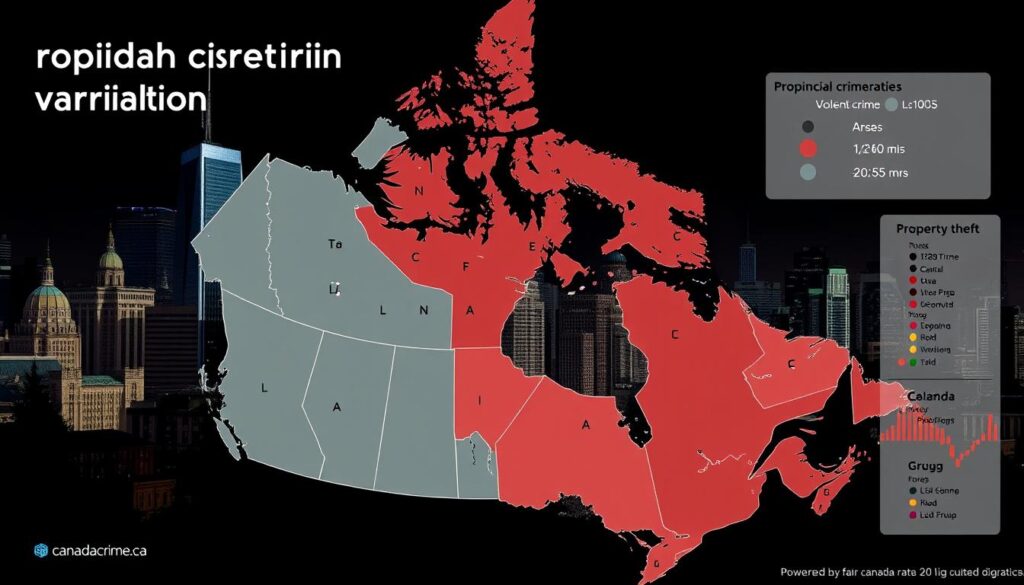
Safety experiences differ dramatically between Manitoba’s prairies and Nova Scotia’s coastal towns. Recent data shows violent offenses occur at 980 incidents rate per 100,000 residents in Saskatchewan – nearly double British Columbia’s figures. These gaps reveal how geography and community structures shape risk profiles.

Variations Across Provinces and Territories
Urban centers like Toronto report higher hate crimes (up 12% since 2022) compared to rural zones. Meanwhile, property crimes dominate Alberta’s smaller cities at 1,140 incidents per 100k – 24% above the national median. Consider these regional contrasts:
| Region | Violent Crime Rate | Property Crime Rate |
|---|---|---|
| New Brunswick | 743 | 892 |
| Yukon Territory | 1,422 | 1,098 |
| Greater Montreal | 658 | 703 |
Youth unemployment rates and housing costs strongly correlate with these patterns. In northern territories, limited social services amplify challenges – a single assault can skew small community metrics significantly.
Metropolitan areas face unique pressures. Vancouver’s downtown core sees 38% more thefts than suburban neighborhoods, while Halifax documents higher cyber-enabled offenses. Understanding these nuances helps tailor local prevention strategies effectively.
“Demographic diversity demands customized solutions – a one-size-fits-all approach fails coastal fishing villages and tech hubs alike.”
Role of Law Enforcement in Crime Data Reporting
Behind every reliable safety metric lies a network of officers meticulously documenting incidents. Local police and national agencies like the RCMP form the backbone of accurate data collection, turning patrol observations into actionable insights.
RCMP and Local Policing Contributions
Provincial forces handle frontline reporting, while the RCMP standardizes processes across jurisdictions. In New Brunswick, this partnership ensures rural thefts receive the same documentation rigor as urban assaults. Recent upgrades to digital reporting tools help track patterns in:
- Repeat offense hotspots
- Seasonal property crime fluctuations
- Case clearance rates for violent acts
How Reporting Impacts Statistics
Discrepancies emerge when regions use different classification methods. A break-in might be logged as “theft” in one precinct but “burglary” elsewhere. These variations explain why New Brunswick’s property crime rates sometimes appear inconsistent with national trends.
Detailed homicide tracking illustrates reporting’s societal value. When officers document weapon types or victim-offender relationships, policymakers gain insights to shape prevention programs. Law enforcement transparency directly affects public trust – incomplete data fuels misconceptions about community risks.
“Our field reports become the foundation for safer neighborhoods. Precision matters as much as speed.” – RCMP Data Integrity Unit
Modernized protocols now flag reporting gaps in real time. This progress helps communities allocate resources where threats – whether violent confrontations or digital fraud – demand immediate attention.
Emerging Cybercrime and Youth Offenses
Digital spaces now host unprecedented risks for young Canadians. Police-reported cyber incidents involving minors surged 52% last year, reshaping how communities approach safety. This change reflects both technological advances and evolving criminal tactics targeting vulnerable groups.

The Rise of Cyber-Related Incidents
Recent data reveals alarming patterns:
- Online child exploitation cases doubled since 2020
- 42% of youth-targeted crimes now involve digital platforms
- Financial scams initiated through gaming apps increased 73%
These incidents often intersect with sensitive issues. For example, crimes related to sexual orientation now frequently occur in virtual spaces, complicating detection efforts. Law enforcement agencies report a 61% jump in cyberbullying cases tied to identity-based harassment.
The number of online fraud cases involving minors tripled since 2022. This shift impacts traditional metrics like rate homicide calculations, as resources divert toward digital investigations. One analyst notes:
“We’re tracking fewer physical confrontations but more psychological harm through screens – this demands new measurement frameworks.”
| Incident Type | 2021 | 2023 |
|---|---|---|
| Child Exploitation | 1,422 | 2,159 |
| Identity Theft | 897 | 1,483 |
| Cyberbullying | 3,045 | 4,912 |
These trends highlight the urgent need for updated prevention strategies. Schools now integrate digital literacy programs, while law enforcement adopts AI tools to flag predatory behavior. Understanding this change helps you protect households while advocating for stronger online safeguards.
Comparative Analysis: Canada and International Crime Data
How does your community’s safety compare to global standards? While property offenses here might feel concerning, they occur at half the rate of similar nations like Sweden. International benchmarks reveal surprising contrasts in safety experiences worldwide.

Global Crime Benchmarks
Canada’s homicide rate sits at 2.25 per 100k – lower than the U.S. (6.3) but higher than Japan (0.2). This pattern reverses for thefts, where residents face 30% fewer incidents than Australians. Key contrasts emerge in this comparison:
| Category | Canada | Germany | U.S. |
|---|---|---|---|
| Violent Crime | 980 | 723 | 1,380 |
| Property Crime | 2,491 | 3,112 | 1,954 |
| Cybercrime Victims | 1 in 4 | 1 in 3 | 1 in 2 |
Northern territories like Yukon show robbery rates triple Finland’s average. Yet urban centers like Toronto report fewer assaults per capita than London or Paris. Three factors explain these gaps:
- Higher police visibility in densely populated provinces
- Stricter gun control than many peer nations
- Social programs reducing repeat offenses
“Canada’s blend of prevention-focused policies and geographic advantages creates unique safety profiles compared to European models.” – Global Safety Institute 2024 Report
These comparisons help you advocate for proven strategies. While challenges exist, understanding global contexts reveals opportunities to enhance local safety measures through international best practices.
Utilizing Data Tools and Sources for Your Analysis
Modern safety analysis demands more than spreadsheets—it requires dynamic tools that bring numbers to life. Interactive platforms transform raw statistics into visual stories, letting you explore patterns through customizable filters and real-time updates. These resources empower both researchers and concerned citizens to make informed decisions.
Interactive Dashboards and Reporting Tools
Leading platforms offer features like:
- Adjustable date ranges to compare year-over-year trends
- Color-coded maps highlighting regional hotspots
- Custom alerts for specific violation categories
Geospatial explorers let you zoom into neighborhoods or compare provinces side-by-side. Filter results by type of offense—like property damage or identity fraud—to isolate critical issues. One user notes: “Seeing hate-related incidents mapped across postal codes changed how we allocate community resources.”
Leveraging Official Sources
Trusted portals provide verified updates without speculation. Key features include:
- Mobile-friendly dashboards with export options
- Detailed breakdowns of unresolved cases
- Social media integration for urgent alerts
Bookmark official sites to track emerging threats in your area. Enable push notifications through their apps to receive updates when new data drops. This proactive approach helps households and businesses stay ahead of evolving risks.
Conclusion
Navigating community safety requires both vigilance and verified insights. Recent analyses reveal how enforcement strategies adapt to evolving threats, from rising cyber incidents to localized drug-related challenges. The Crime Severity Index remains crucial for measuring progress, balancing frequency with societal impact.
Interactive tools transform complex data into actionable knowledge. Law enforcement transparency and digital reporting innovations help identify emerging patterns. You can explore these trends through official platforms, comparing regional shifts or demographic-specific risks.
Staying informed empowers proactive responses. While property offenses decline nationally, digital fraud and youth-targeted crimes demand renewed focus. Regularly reviewing updated metrics ensures your awareness aligns with current realities.
Visit trusted sources to deepen your understanding of the justice system’s evolving role. Your engagement strengthens community resilience—whether addressing drug distribution networks or safeguarding virtual spaces. Knowledge remains your strongest tool in shaping safer neighborhoods.

