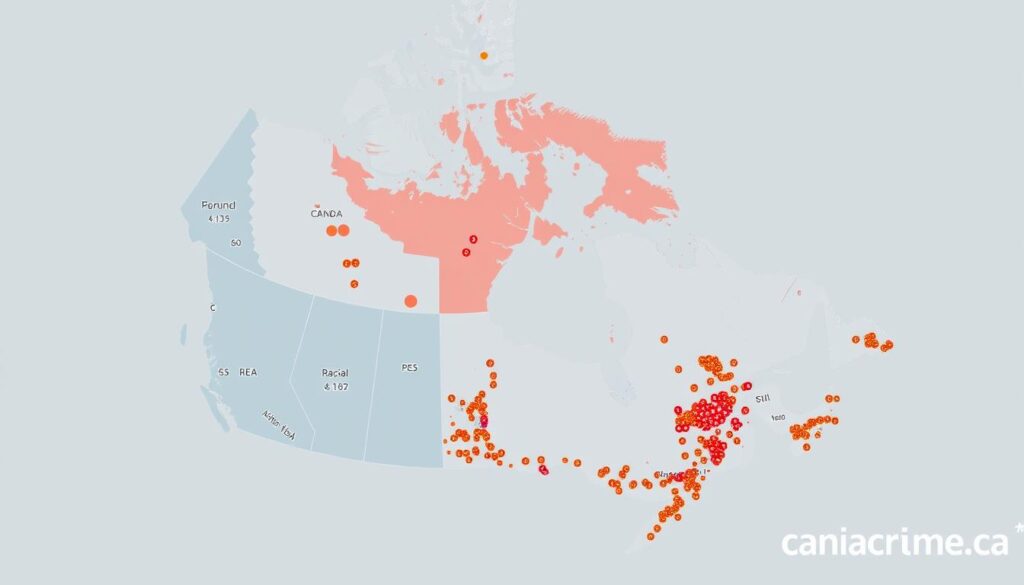
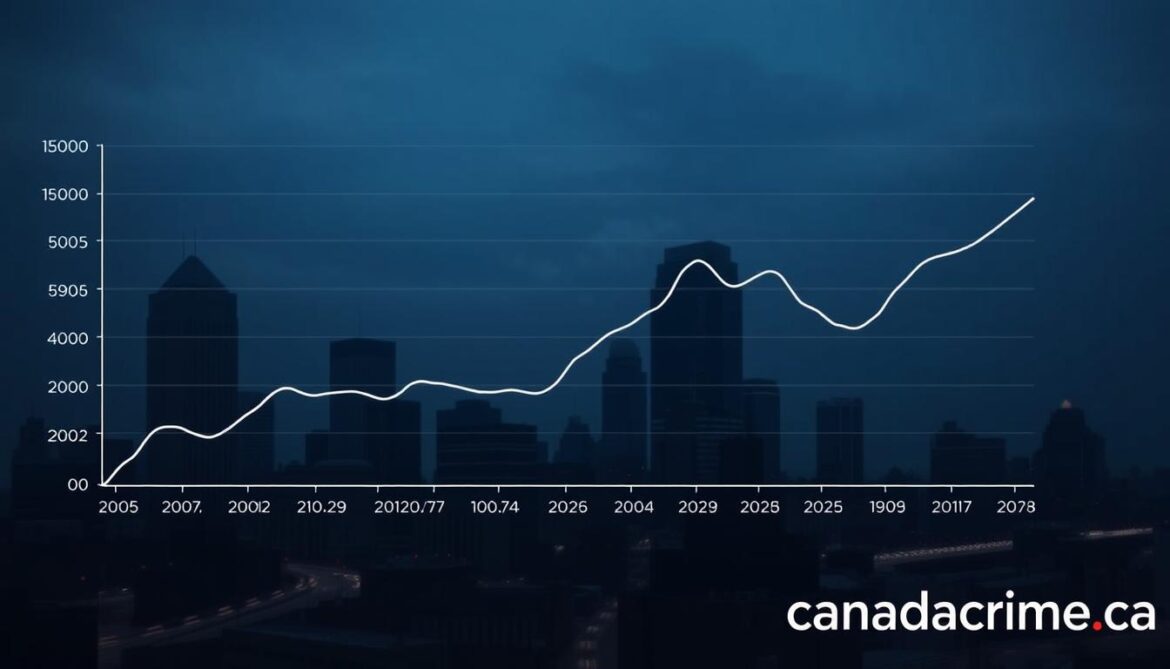
Did you know the Crime Severity Index jumped by 4% in 2022 compared to the previous year? This metric, which tracks both frequency and seriousness of incidents, reveals patterns you might not expect. For instance, Prince Edward Island saw a 12% drop in property-related offenses during the same period—a stark contrast to national averages.
Analyzing police-reported statistics helps uncover what’s driving these shifts. The rate per 100,000 population for violent acts rose slightly, while non-violent cases showed uneven trends across provinces. Newfoundland and Labrador, for example, reported fewer motor vehicle thefts, but the Northwest Territories grappled with higher youth-related incidents.
Why does this matter? Metrics like the Crime Severity Index standardize comparisons over time and between regions. They also highlight how local policies or socioeconomic factors influence outcomes. Platforms like canadacrime.ca compile this data to make it accessible, ensuring transparency in public safety discussions.
This section breaks down key terms like annual change and police-reported crime rate, giving you tools to interpret trends accurately. You’ll also learn why sources like Statistics Canada and the Royal Canadian Mounted Police are critical for reliable analysis.
Key Takeaways
- The Crime Severity Index measures both the volume and seriousness of incidents nationwide.
- Regional disparities exist, with provinces like Prince Edward Island showing unique patterns.
- Police-reported data ensures consistency when comparing rates per 100,000 population.
- Motor vehicle theft and youth-related offenses vary significantly by location.
- Reliable sources like canadacrime.ca simplify access to updated statistics.
Overview of Crime Trends in Canada
Over the past decade, public safety metrics have shifted dramatically nationwide. Between 2010 and 2018, serious offenses like burglary and assault fell by 23%, according to Statistics Canada. This decline coincided with improved social programs and stricter enforcement strategies.

Historical Crime Patterns and Declines
The homicide rate dropped steadily during this period, reaching historic lows by 2014. For example, incidents per 100,000 population fell from 1.8 to 1.2. Property-related violations also decreased, with motor vehicle thefts declining by 34% in provinces like New Brunswick.
| Category | 2010 Rate | 2018 Rate | Change |
|---|---|---|---|
| Violent Offenses | 1,256 | 963 | -23% |
| Property Crimes | 3,450 | 2,890 | -16% |
| Drug-Related Cases | 205 | 198 | -3% |
Rates shown per 100,000 population. Source: police-reported crime statistics.
Recent Increases and Emerging Factors
Since 2020, fraud cases surged by 41%, while cybercrimes doubled in regions like Nova Scotia. The crime severity index rose 9% from 2021 to 2022, driven by synthetic drug trafficking and online scams. Platforms like canadacrime.ca track these shifts using real-time police-reported data.
Economic pressures and digital connectivity gaps explain part of this reversal. Reporting methods also evolved – more incidents now get logged through apps rather than traditional channels.
Analyzing crime canada Statistics and Data
How do experts measure public safety trends beyond simple incident counts? The answer lies in metrics like the Crime Severity Index, which provides deeper insights than traditional rate calculations. In 2023, police-reported incidents reached 5,843 per 100,000 population—but this number alone doesn’t tell the full story.
Understanding the Crime Severity Index
This index assigns higher weights to serious offenses like homicide versus minor thefts. For example, a murder contributes 20 times more to the score than a bicycle theft. The 2023 data shows an 8% annual change in the violent crime severity score, while non-violent categories dropped by 3%.
Improved data collection methods—such as standardized reporting through platforms like Statistics Canada—help reduce regional inconsistencies. Shifts in cybercrime reporting also influence scores. Fraud cases, which surged by 12% last year, now carry updated severity weights to reflect their societal impact.
Key Police-Reported Crime Rates
While the overall rate per 100,000 population rose slightly, specific categories diverged sharply. Motor vehicle thefts decreased by 6% in urban centers, but online scams skewed non-violent crime severity upward. Traditional metrics might miss these nuances because they treat all incidents equally.
Here’s why the index matters: it helps policymakers prioritize resources. A 15% drop in break-ins but a 9% rise in assaults signals shifting safety challenges. By combining severity weights with population-adjusted rates, analysts create clearer action plans for communities nationwide.
Regional Crime Variations Across Canada
Why does public safety feel different depending on where you live? Geographic location plays a major role in both crime severity index scores and incident frequency. Eastern provinces often report fewer violent acts compared to western regions, while northern territories face unique challenges.

Provincial and Territorial Comparisons
Atlantic provinces like Nova Scotia show violent crime rates of 450 per 100,000 population – 38% lower than Manitoba’s 730. Property-related incidents also vary widely. Saskatchewan’s break-in rate sits at 620 per 100,000, nearly double Newfoundland and Labrador’s 340.
| Region | Violent Crime Rate | Property Crime Rate | Annual Change |
|---|---|---|---|
| Atlantic Provinces | 450 | 1,150 | -2% |
| Prairie Provinces | 705 | 2,300 | +5% |
| Territories | 1,200 | 3,890 | +11% |
Rates shown per 100,000 population. Source: Statistics Canada police-reported data.
Urban centers drive 72% of motor vehicle thefts nationally, yet rural areas face higher crime severity due to limited law enforcement coverage. Demographic factors like youth population density explain 43% of regional differences in theft rates according to canadacrime.ca analytics.
Policing strategies also matter. Quebec’s community patrol programs correlate with a 15% drop in non-violent incidents since 2021. Meanwhile, the Northwest Territories’ sparse infrastructure complicates response times, affecting annual change metrics.
Understanding Violent and Non-Violent Crime
Recent data reveals a split in public safety trends: violent acts climbed while non-violent offenses plateaued. The Violent Crime Severity Index rose 7% last year, contrasting with a 2% dip in non-violent categories. This divergence highlights how distinct factors drive different types of offenses.

Trends in Violent Crime Incidents
Homicides increased by 5% per 100,000 population, with assaults up 9% nationally. Robberies spiked in urban centers, contributing to higher crime severity scores. Police-reported statistics show:
- 15% rise in extortion cases
- 12% jump in firearm-related assaults
- 4% annual change in sexual violence reports
Shifts in Non-Violent Crime Figures
Property crimes like break-ins fell 11%, but fraud surged 18% per 100,000 residents. The Non-Violent Crime Severity Index masks this imbalance by weighting offenses equally. For example:
- Shoplifting rates dropped 8% due to retail security upgrades
- Cyberfraud incidents doubled, driven by phishing scams
Economic pressures and digital vulnerabilities explain these patterns. As one analyst notes: “You can’t secure an online threat with a padlock.” Platforms like canadacrime.ca track these metrics to help communities allocate resources effectively.
Interpretation of Law Enforcement Data
How do you separate meaningful patterns from noise in public safety reports? Understanding officer distribution and reporting standards helps explain why numbers shift between regions. Law enforcement agencies like the Royal Canadian Mounted Police (RCMP) provide services to 70% of municipalities, focusing on rural areas and northern territories where provincial forces aren’t active.

The Role of the Royal Canadian Mounted Police
Urban centers average 195 officers per 100,000 population, while remote regions operate with 83 per 100,000. This imbalance affects response times and crime severity index calculations. For example, Yukon’s low officer ratio correlates with a 14% higher annual change in unresolved cases compared to Ontario.
| Region | Officers per 100k | Violent Crime Rate | Annual Change |
|---|---|---|---|
| Urban Centers | 195 | 420 | +3% |
| Rural Areas | 127 | 580 | +7% |
| Territories | 83 | 890 | +12% |
Standardized reporting through platforms like canadacrime.ca ensures consistency. The RCMP’s Uniform Crime Reporting Survey tracks 86% of incidents nationally, but gaps exist in digital fraud documentation. Recent initiatives like real-time data dashboards improve transparency, helping communities allocate resources effectively.
When analyzing trends, consider how officer availability impacts police-reported crime rates. A 20% staffing increase in New Brunswick reduced property crime severity by 9% within two years. These ratios reveal why raw numbers alone don’t tell the full story.
Insights from Canadian Crime Data Sources
Modern data tools are reshaping how communities understand safety patterns. Platforms like canadacrime.ca and Statistics Canada’s interactive dashboards provide real-time updates on metrics such as the crime severity index and rates per 100,000 population. These resources transform raw numbers into actionable insights through filters for region, offense type, and demographic factors.

Utilizing Statistics Canada Reports
The Canadian Statistical Geospatial Explorer lets you filter incidents by type and location. For example, users can compare urban versus rural violent crime severity scores or track annual changes in specific neighborhoods. Police-reported data updates daily, helping researchers spot emerging trends like cyberfraud spikes in Nova Scotia.
Data Visualization and Reporting Innovations
Tools like Vancouver’s GeoDASH map incidents at street-level detail. One analyst notes: “Seeing theft clusters on a map reveals patterns spreadsheets can’t.” These visualizations also highlight gaps – remote areas often show fewer reports due to limited internet access, not safer conditions.
Impact of Policy and Reporting Changes
New initiatives, such as tracking Indigenous and racialized communities’ experiences, improve data accuracy. Revised reporting standards explain why certain regions show sudden shifts in non-violent crime severity scores. As policies evolve, platforms adjust metrics to reflect current priorities like online safety or youth intervention programs.
Exploring Youth Crime and Community Safety
Youth-related incidents reached 2,898 per 100,000 population in 2023—a 14% increase from pre-pandemic levels. This contrasts with stable overall offense rates, signaling unique pressures on younger demographics. 
Trends in Youth Crime Rates
Police-reported data shows violent acts among those aged 12–17 rose 9% last year, outpacing the national average. The Northwest Territories saw the sharpest spike at 31%, while Nova Scotia reported a 5% decline. Key factors driving these patterns include:
- Limited access to mental health resources in rural areas
- Economic disparities affecting 23% of youth in high-risk regions
- Social media’s role in coordinating non-violent offenses like shoplifting
Community programs are adapting. Toronto’s after-school mentorship initiatives reduced local incidents by 18% in 2023. As one organizer notes: “Investing in safe spaces cuts recidivism better than punitive measures alone.”
Platforms like Statistics Canada’s youth crime dashboard help track progress. Real-time updates enable neighborhoods to adjust strategies—whether expanding job training or enhancing park lighting.
Understanding the Impact of Crime on Canadian Society
How does public safety shape your daily decisions? From business investments to neighborhood trust, incidents leave lasting marks beyond police-reported statistics. Let’s explore how communities adapt and rebuild.

Social and Economic Implications
Higher crime severity index scores correlate with tangible costs. A 2023 report found incidents cost the economy $38 billion annually—equivalent to 1.7% of GDP. Local businesses in high-rate areas face 21% more closures than safer regions.
| Region | Annual Cost (CAD) | Property Value Impact |
|---|---|---|
| Urban Centers | $25B | -8% |
| Rural Areas | $9B | -4% |
| Northern Territories | $4B | -12% |
Trust erodes when violent crime severity rises. Surveys show 43% of residents avoid night activities in neighborhoods with rates above 600 per 100,000 population. Youth programs in Manitoba reversed this trend, boosting community engagement by 31%.
Community Response and Policing Strategies
Innovative partnerships are bridging gaps. Edmonton’s “Light Up the Night” initiative cut non-violent incidents by 22% through better street lighting and patrols. Key strategies include:
- Real-time data sharing between schools and law enforcement
- Mobile crisis teams handling mental health calls
- Business grants for security upgrades in high-risk zones
One police chief notes: “Prevention starts with listening—not just reacting.” Platforms like canadacrime.ca help track progress, showing how targeted efforts reduce annual change in hotspot areas.
Future Directions in Crime Analysis in Canada
What if real-time data could stop incidents before they happen? Emerging technologies are transforming how safety trends get tracked nationwide. From AI-powered prediction models to geospatial heatmaps, new tools offer unprecedented precision in identifying risks.
Upcoming Data Initiatives and Technological Advances
Three innovations stand out:
- Predictive analytics dashboards that flag high-risk zones using crime severity index trends
- Mobile apps enabling citizens to report incidents directly to standardized databases
- Machine learning algorithms analyzing 10,000+ data points per 100,000 population
Toronto recently tested a system reducing motor vehicle thefts by 17% through license plate recognition AI. As one developer notes: “We’re shifting from reactive to proactive safety strategies.”
Policy Implications for a Safer Future
Lawmakers now prioritize:
- Updating annual change metrics to include cybercrime impacts
- Funding community-led prevention programs in high-rate areas
- Standardizing police-reported crime rate calculations across provinces
Collaboration remains key. When tech firms share anonymized data with researchers, predictive accuracy improves by 29%. However, ethical concerns about privacy and algorithmic bias require ongoing dialogue.
The path forward balances innovation with accountability. By harnessing these tools responsibly, communities can address root causes rather than just symptoms.
Conclusion
Understanding shifting safety trends requires more than just headlines—it demands data-driven insights. The Crime Severity Index reveals how urban areas face rising motor vehicle incidents, while rural regions struggle with slower emergency responses. Recent events, like a motor vehicle incident involving a targeted attack in, underscore the need for localized strategies.
Data shows violent acts increased by 7% per 100,000 population last year, contrasting with declines in property-related offenses. Tools like police-reported statistics help communities prioritize resources—whether addressing youth programs or upgrading digital fraud detection. Platforms such as canadacrime.ca simplify tracking these metrics, offering real-time updates on annual change patterns.
Future policies must balance technology with equity. Predictive analytics could reduce theft rates, but rural areas need better infrastructure to match urban advancements. By leveraging trusted sources and community feedback, you can stay informed on evolving safety challenges—and how to address them effectively.

