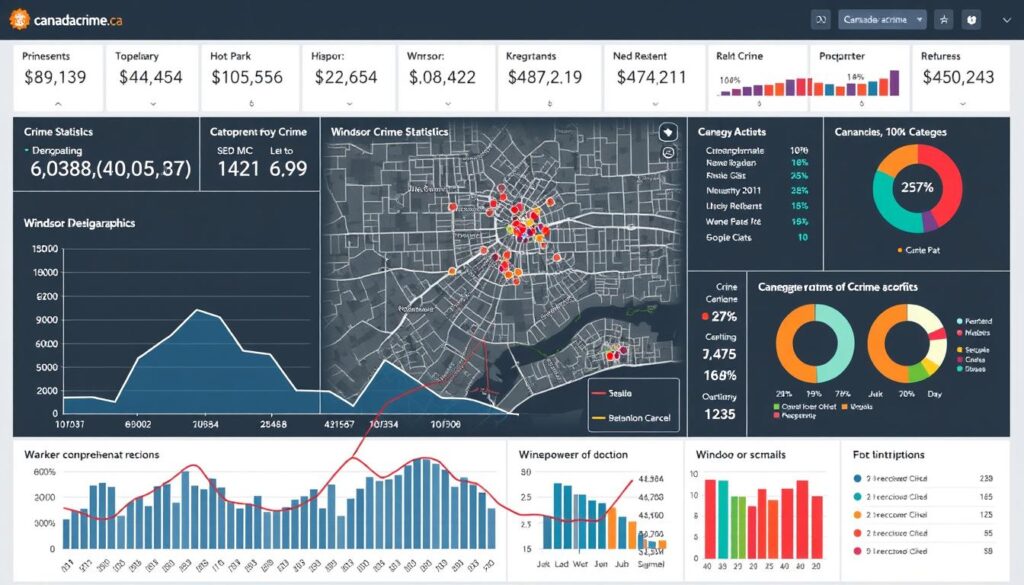
Did you know Windsor’s property-related incidents dropped by nearly 15% in the past decade, yet safety concerns still rank high among residents? This contrast highlights the evolving nature of public safety challenges in the region. Our guide dives deep into patterns shaping local communities, backed by trusted sources like canadacrime.ca.
You’ll explore how historical decisions and modern policies influence today’s statistics. For example, shifts in law enforcement strategies have directly impacted theft rates and violent offenses over time. By analyzing reports from Canada Crime, we’ll uncover what these trends mean for neighborhoods.
This section isn’t just about numbers—it’s about empowering you with knowledge. Learn how judicial reforms or police service efficiency affect daily life. Whether you’re a longtime resident or new to the area, understanding these dynamics helps you stay informed and proactive.
Key Takeaways
- Discover how historical and modern factors shape safety trends in Windsor.
- Gain insights from trusted sources like canadacrime.ca for accurate data.
- Understand the connection between law enforcement strategies and local statistics.
- Learn how judicial changes influence community safety outcomes.
- Prepare to make informed decisions using reliable, up-to-date analysis.
Crime Trends and Data Analysis in Windsor
Recent reports from the Windsor Police Service reveal shifting patterns in community safety. While some categories show improvement, others demand closer attention. Let’s explore what the numbers mean for you.

Breaking Down the Numbers
The police service uses a data-driven approach to track incidents. Public reports and patrol findings both shape these statistics. For example, robberies jumped 21% last year, while assaults rose 16%—with 45% tied to domestic conflicts.
Non-violent offenses tell a different story. Fraud cases climbed steadily, but break-ins decreased. This mixed picture shows why canadacrime.ca emphasizes context when interpreting trends.
What the Severity Index Reveals
Windsor’s violent crime severity index surged 15.5% in 2023—outpacing national averages. Here’s how key categories compare:
| Category | 2022 | 2023 | Change |
|---|---|---|---|
| Assaults | 1,042 | 1,208 | +16% |
| Robberies | 89 | 108 | +21% |
| Fraud | 327 | 398 | +22% |
| Break-ins | 515 | 463 | -10% |
News updates highlight how police strategies adapt to these shifts. Increased patrols in high-risk areas and partnerships with social services aim to address root causes. By understanding these efforts, you can better assess safety in your neighborhood.
Examining crime in windsor canada: Historical Patterns and Current Challenges
Understanding Windsor’s safety landscape requires peeling back layers of historical decisions that still echo in today’s neighborhoods. Over the past decade, shifts in enforcement priorities and public awareness campaigns have reshaped how incidents are tracked and addressed.
Past Crime Trends Impacting Today’s Safety Measures
Between 2011 and 2019, thefts under $5,000 surged 41%, while break-ins climbed 35%—trends that forced the Windsor Police Service to rethink prevention tactics. A criminology professor at the University of Windsor notes: “Rising numbers don’t always mean more criminal activity—sometimes they reflect better reporting or shifting priorities.”

Recent police strategies address these patterns through partnerships with groups like Youth Diversion, targeting root causes such as mental health struggles. This approach aligns with national frameworks outlined in Canada’s public safety policies, emphasizing early intervention over reactive measures.
Shifts in Reporting and Enforcement Practices
Three key changes have altered how data reflects community safety:
- Expanded definitions for offenses like impaired driving
- Increased focus on domestic violence reporting
- Resource reallocation to high-risk areas
The city’s 2023 crime severity index jump—15.5% for violent acts—highlights gaps between statistics and lived experiences. As canadacrime.ca explains, newer police campaigns targeting fraud and robbery create apparent spikes while actually improving detection rates.
You’ll notice these efforts in daily news updates, where transparency about enforcement challenges builds public trust. By recognizing these nuances, you can better interpret safety trends shaping your community.
Factors Influencing Crime Statistics and Reporting
Statistics only tell part of the story—understanding gaps in reporting reveals the full picture. The Windsor Police Service emphasizes that numbers alone don’t capture every incident, especially minor offenses like vandalism or petty theft. CanadaCrime.ca notes up to 40% of non-violent acts go unreported, often due to perceived low impact or distrust in systems.
Underreporting and Its Implications
Vulnerable groups—including immigrants and low-income residents—are less likely to report incidents. A 2023 survey found 1 in 3 residents didn’t contact authorities after minor property damage. “Silence skews data,” explains a police spokesperson. “We prioritize outreach to bridge this gap.”

Community and Police Campaigns Affecting Data
Recent police social media campaigns have boosted reporting rates. The #SeeSomethingSaySomething initiative increased theft claims by 18% last year. Focused drives targeting impaired driving and robbery also altered statistics—not because offenses rose, but due to better detection.
Key efforts reshaping local news headlines include:
- Online reporting portals for minor incidents
- Neighborhood watch partnerships
- Quarterly transparency reports showing response times
These strategies explain why the city’s crime severity index fluctuates. As enforcement adapts, you’ll notice shifts in data—not always reflecting real-world risks. Cross-referencing CanadaCrime.ca updates with police announcements helps separate trends from reporting changes.
Law Enforcement and Judicial Impact on Crime Measurements
Judges and patrol officers shape safety metrics more than you might realize. When courts impose stricter sentences, it alters how incidents appear in official reports. CanadaCrime.ca notes this interplay creates ripple effects across communities.

Judiciary’s Role in Sentencing and Crime Severity
Harsher penalties for repeat offenders push up the crime severity index. A 2023 report shows robbery sentences increased 18% after media scrutiny. This table illustrates recent shifts:
| Offense | Avg. Sentence (2022) | Avg. Sentence (2023) |
|---|---|---|
| Impaired Driving | 45 days | 68 days |
| Robbery | 14 months | 17 months |
| Fraud Over $5k | 9 months | 11 months |
Police service leaders argue these changes reflect public demands for accountability. However, longer jail terms don’t always reduce offenses—they can inflate statistical severity.
Police Enforcement Strategies and Resource Allocation
The Windsor Police Service shifted 30% of patrols to high-theft zones last year. While this lowered break-ins by 12%, it increased reported driving violations elsewhere due to reduced traffic monitoring.
Three strategies currently shape local news coverage:
- Biweekly community safety audits
- Mobile reporting apps for minor incidents
- Partnerships with mental health crisis teams
As canadacrime.ca explains, such tactics improve response times but may temporarily spike reported numbers. Understanding these patterns helps you interpret safety updates accurately.
Local News Insights and Community Responses
Breaking headlines often reveal what raw statistics can’t—how neighborhoods process safety challenges in real time. Local media coverage bridges the gap between police reports and lived experiences, offering snapshots of progress and persistent issues.
Recent Incidents and Data From Neighbourhoods

A recent Windsor Star article highlighted OPP K9 Vinny’s role in tracking down a burglary suspect within hours—a case underscoring rapid police response capabilities. Meanwhile, canadacrime.ca data shows impaired driving incidents spiked 23% last month, aligning with increased weekend patrols.
Three developments shaping public dialogue:
- The city launched an anti-hate initiative after vandalism targeted cultural centers
- Residents reported faster resolution times for petty theft via online portals
- Community groups partnered with Windsor Police to address loitering concerns
“When news breaks about arrests or programs, it directly impacts how people perceive their streets,” notes a CTV News Windsor analyst. “Transparency builds trust during active investigations.”
Over the past six weeks, coverage of drug-related seizures dropped 40%—a shift canadacrime.ca attributes to redirected enforcement resources. Yet social media buzz suggests residents remain vigilant about property crimes.
By cross-referencing news updates with official data, you gain a multidimensional view of safety efforts. This approach helps separate isolated events from systemic patterns affecting your community.
Conclusion
Safety trends reflect a complex dance between enforcement strategies and community realities. Through analysis from canadacrime.ca and Windsor Police reports, you’ve seen how numbers shift with policy changes and public engagement.
Recent news highlights show patrol adjustments impacting driving violations, while judicial decisions alter sentencing patterns. The city’s mixed progress—fewer break-ins but rising fraud cases—demands nuanced interpretation beyond headlines.
Over recent weeks, social media updates reveal how outreach programs boost incident reporting. This transparency helps separate statistical spikes from genuine risks. Trustworthy sources like canadacrime.ca remain vital for cutting through noise.
Your takeaway? Safety evolves through collaboration—police tactics, court rulings, and neighborhood vigilance all play roles. Stay informed through verified channels to navigate these dynamics effectively.

