Toronto has been recognized as one of the safest major cities globally. In 2024, The Economist ranked it 6th among 60 large cities for safety, making it the safest major city in North America. This distinction is noteworthy, especially when compared to other major cities worldwide.
Despite fluctuations in crime statistics over the years, Toronto maintains its reputation for safety. The city’s crime data provides valuable insights into its safety landscape. This article will delve into Toronto’s crime statistics, historical trends, and comparisons with other major cities, both within Canada and internationally.
By examining official data from police reports and independent studies, we aim to present an accurate picture of safety in Canada’s largest city, helping residents and visitors make informed decisions.
The Current State of Crime in Toronto
Toronto, being one of North America’s major cities, has a crime profile that is closely monitored by law enforcement and the public. As the fourth largest city in North America, Toronto’s crime rate is often compared to other major metropolitan areas. Despite its size, Toronto maintains a relatively low homicide rate, fluctuating between 2.1 and 3.8 per 100,000 people over the 2010s, which is comparable to modern-day New York.
Toronto’s Safety Ranking in 2024
Toronto consistently ranks among the safest major cities in North America according to multiple international safety indices. The Economist ranked Toronto as the 6th safest major city globally in 2024, reinforcing its reputation as a secure urban center. This ranking is a testament to the city’s effective law enforcement strategies and community-based initiatives. Toronto’s safety profile is complex, with different types of crimes showing varying trends.

Major Crime Indicators Overview
According to the Toronto Police Service’s Major Crime Indicators, there were 37,320 major crimes investigated by police year to date in 2024, representing a decrease of 1.3% over the 39,019 reported by this time in 2023. This decrease follows a 19.8% increase from 2022 to 2023, indicating a fluctuation in crime rates. The data shows that while some categories like auto theft have decreased significantly (down 21.3%), others like sexual violations have increased (up 13.1%). The city’s overall Crime Severity Index remains lower than many other major Canadian cities, reinforcing Toronto’s reputation as one of the safer large urban centers in Canada.
Historical Crime Trends in Toronto
Understanding Toronto’s crime trends requires a look back at the city’s history, where crime patterns have evolved substantially over time. The city’s crime landscape has been influenced by various factors, including socio-economic conditions, law enforcement strategies, and the presence of organized crime.
Crime Patterns from the 1980s to 2000s
The late 1980s marked a turning point in Toronto’s crime landscape, with gang violence escalating alongside the introduction of crack cocaine into the city’s low-income neighborhoods. This period saw a significant increase in gun violence, a trend that continued into the early 1990s. In 1991, Toronto experienced its most violent year with 89 murders, many of which were linked to drug wars between rival gangs.
However, the city experienced a period of relative calm in the late 1990s, with 1999 recording only 49 homicides – the lowest total since 1986. This gave Toronto a murder rate of just 1.68 per 100,000 people, indicating a brief respite in the otherwise fluctuating crime trends.
| Year | Homicides | Murder Rate per 100,000 |
|---|---|---|
| 1986 | 49 | 1.68 |
| 1991 | 89 | 3.04 |
| 1999 | 49 | 1.68 |
The “Year of the Gun” and Its Aftermath
The year 2005 became known as the “Year of the Gun” in Toronto due to a record number of gun-related homicides. A total of 52 out of 80 murders were gun-related, nearly double the previous year’s gun deaths. This peak in gun violence was a significant concern for law enforcement and the community, leading to calls for stricter gun control legislation.
The aftermath of the “Year of the Gun” saw fluctuating but generally declining murder rates from 2007 through 2014. This demonstrated the cyclical nature of crime trends in Toronto, influenced by various factors including law enforcement strategies and community initiatives.
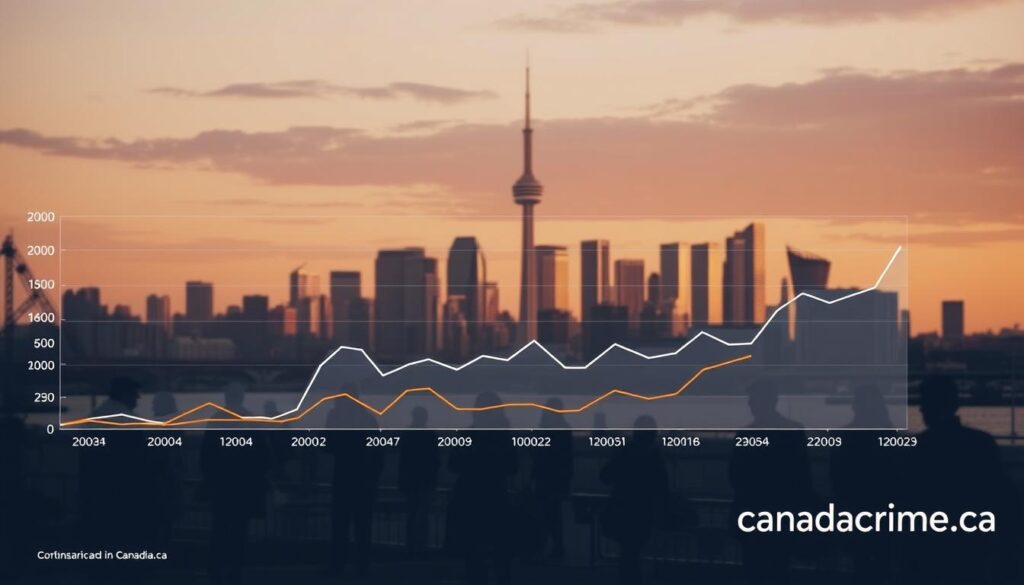
The historical crime trends in Toronto highlight the complexity of factors influencing crime rates, from socio-economic conditions to law enforcement approaches. Understanding these trends is crucial for developing effective crime prevention strategies.
Recent Crime Rate Developments (2015-Present)
Toronto’s crime landscape has undergone significant changes since 2015, with notable shifts in homicide rates and shooting incidents. The city’s crime trends have been marked by periods of increase and decrease, reflecting the complex nature of urban crime dynamics.
Fluctuations in Homicide Rates
After a period of relative stability from 2009 to 2015, Toronto’s homicide rate began to rise in 2016. The number of homicides jumped to 75 in 2016 and spiked dramatically in 2018 with 98 homicides, partly due to the Toronto van attack that resulted in 10 deaths on April 23, 2018. This incident pushed Toronto’s homicide rate to approximately 3.6 per 100,000 people, surpassing New York City’s rate for the same year.
Recent years have shown some improvement, with homicides decreasing to 71 in 2022 and 73 in 2023. However, 2024 has seen another increase, with 86 homicides reported, raising the rate to approximately 3.1 per 100,000 residents. These fluctuations highlight the challenges facing law enforcement and community safety initiatives in Canada’s largest city.
| Year | Homicides | Rate per 100,000 |
|---|---|---|
| 2016 | 75 | 2.8 |
| 2018 | 98 | 3.6 |
| 2022 | 71 | 2.6 |
| 2023 | 73 | 2.7 |
| 2024 | 86 | 3.1 |
Shooting Incidents and Gun Violence Trends
Shooting incidents in Toronto have shown a parallel increase, rising from a decade-low of 177 in 2014 to an all-time high of 495 in 2019. This gave Toronto a shooting rate of 18.1 per 100,000 people, double that of New York City. The trend in shooting incidents closely mirrors the fluctuations in homicide rates, indicating a broader issue with gun violence in the city.
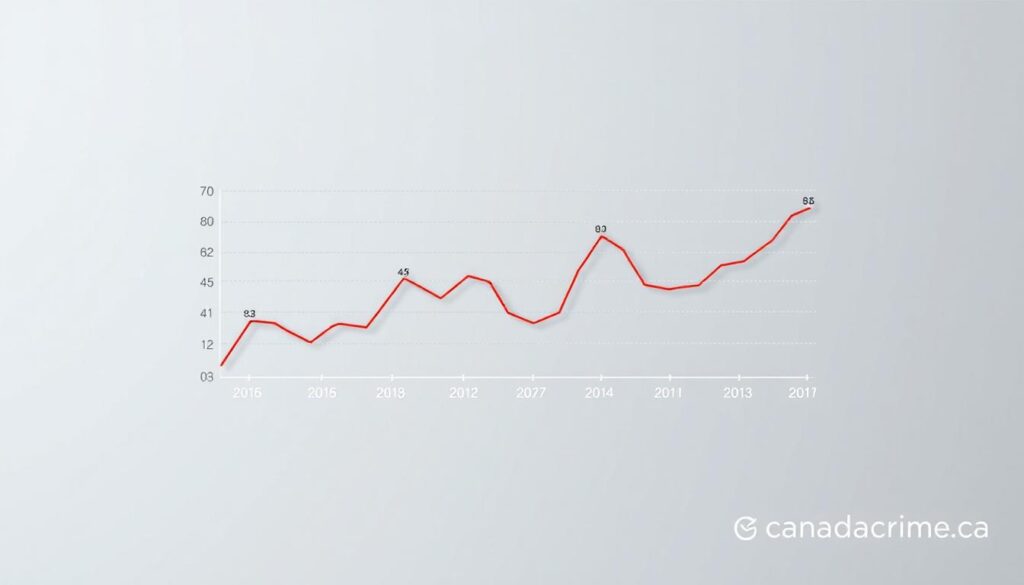
The complex interplay of factors contributing to these crime trends underscores the need for multifaceted approaches to crime prevention and community safety in Toronto.
Top Criminal Offenses in Toronto
Crime statistics reveal a nuanced picture of Toronto’s safety and security challenges. The Toronto Police Service’s latest data provides insights into the most prevalent crimes affecting the city.

Most Common Major Crimes
The top ten major offenses reported by the Toronto Police Service for 2024 to date highlight the complexity of crime in the city. Assault remains the most prevalent major offense with 18,818 reported incidents, marking a 5.7% increase. Auto theft, despite a 21.3% decrease, continues to be a significant concern with 7,045 incidents. The data indicates that while certain property crimes are decreasing, violent and personal crimes are on the rise.
- Assault cases reached 18,818, a 5.7% increase.
- Auto theft decreased by 21.3% to 7,045 incidents.
- Breaking and entering offenses slightly decreased to 5,030.
Emerging Crime Patterns
Emerging trends in crime patterns suggest a shift towards more violent offenses. Sexual violations have seen a significant 13.1% increase to 2,630 reported incidents, indicating a growing concern for public safety. The prevalence of weapon-related offenses, including assault with a weapon (4,489 cases) and robbery with a weapon (988 cases), underscores the ongoing issue of weapons in the city.
As noted by crime experts, “The rise in violent crimes necessitates a multifaceted approach to crime prevention, focusing on both community engagement and law enforcement strategies.”
“The rise in violent crimes necessitates a multifaceted approach to crime prevention.”
Crime Rate in Toronto Compared to Other Canadian Cities
In the context of Canadian urban safety, Toronto’s crime statistics offer a compelling case study. When evaluating crime rates across different cities, various factors come into play, including the type of crimes and the population size of the metropolitan areas.
Toronto vs. Other Major Metropolitan Areas
Toronto maintains a favorable position in Canadian safety rankings. According to a 2024 report by CTV News, Toronto is identified as the safest city in Canada, with a crime rate of 286.9 offenses per 100,000 residents. This ranking is based on 2023 data and considers various crimes such as arson, robbery, impaired driving, and burglary. In comparison, Quebec City had 301 offenses per 100,000 people, and Ottawa-Gatineau recorded 318.8 offenses per 100,000 residents, placing them second and third, respectively.
- Toronto outperforms other major metropolitan areas like Quebec City and Ottawa-Gatineau.
- The city’s crime rate of 286.9 offenses per 100,000 residents reinforces its status as a relatively safe large urban center.
- Census metropolitan areas in Quebec and Ontario generally show lower crime rates than those in western provinces.
Crime Severity Index Comparisons
The Crime Severity Index (CSI) provides a more nuanced view of public safety by weighing crimes based on their seriousness. According to the CSI, Toronto remains among the safer major cities in Canada. This index helps in understanding that while raw crime numbers are important, the severity of crimes also plays a crucial role in assessing the safety of a city.
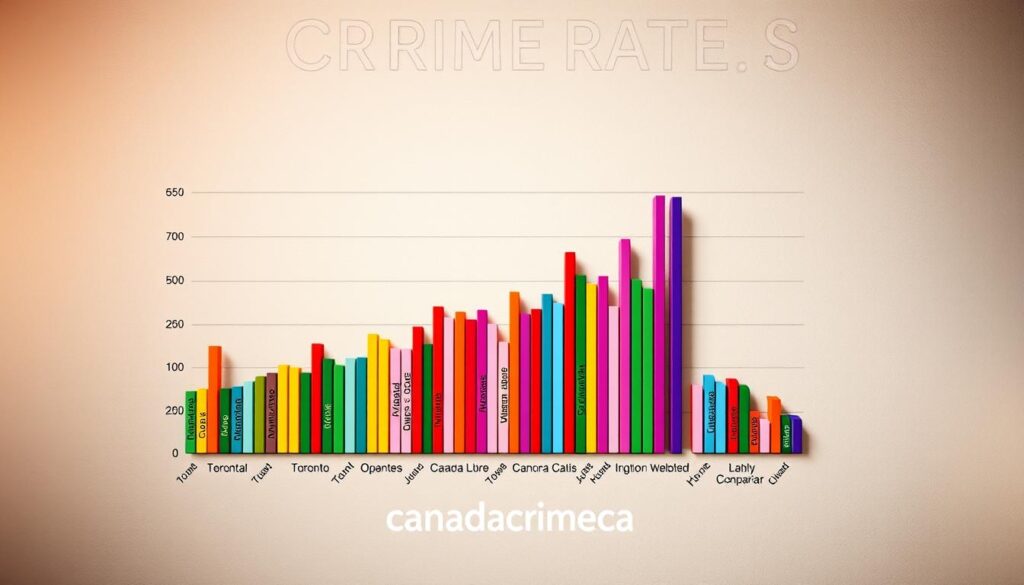
Notably, cities like Thunder Bay consistently rank high in both property crimes and violent crimes, creating a stark contrast with Toronto’s relatively lower rates. These comparisons help contextualize Toronto’s crime situation within the broader Canadian landscape, showing that despite being Canada’s largest city, it maintains relatively good safety metrics compared to other urban centers.
Toronto vs. American Cities: Crime Rate Analysis
A study comparing Toronto’s crime rates to those of major American cities uncovers some surprising trends and differences. The analysis, conducted by the Fraser Institute, provides a comprehensive look at how Toronto stacks up against its U.S. counterparts in terms of crime.
Property Crime Comparisons
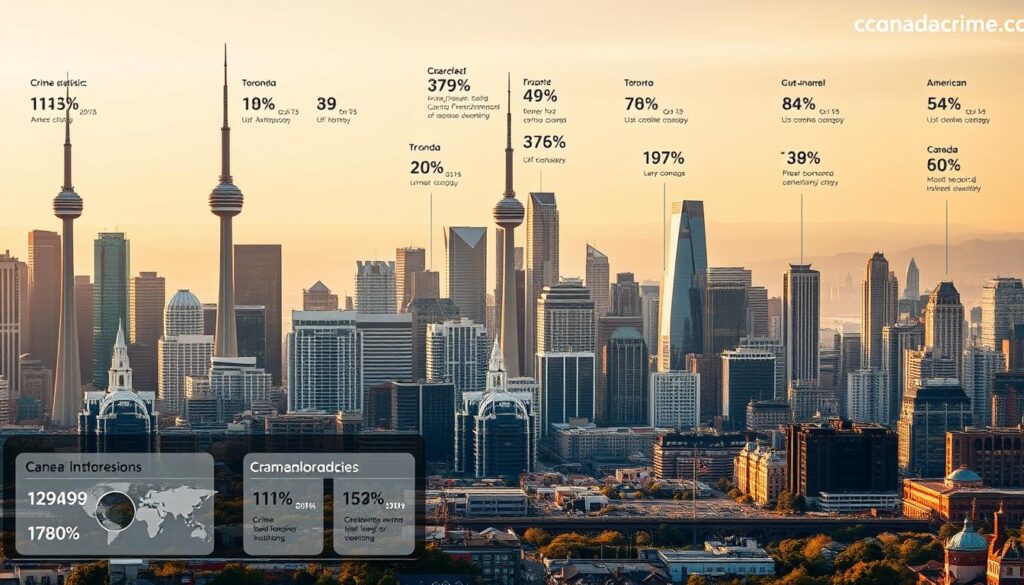
The rate of property crimes per person in Toronto is 40% higher than in New York, according to the Fraser Institute study. This finding challenges the common perception that Canadian cities are safer than their American counterparts. Other Ontario cities, including Hamilton and Windsor, also ranked higher for property crime than New York, Detroit, and several Michigan cities. This suggests a regional pattern rather than a Toronto-specific issue.
Violent Crime Comparisons
Despite having a higher property crime rate, Toronto maintains a significantly lower violent crime profile than most major American cities. Toronto’s homicide rate has fluctuated between 2.1 and 3.8 per 100,000 people over the past decade, which is comparable to modern-day New York. However, it is substantially lower than cities like Atlanta (19.0 per 100,000), Chicago (18.5), and Boston (9.0). This highlights the stark difference in lethal violence between Canadian and American urban centers.
The study’s findings underscore the complexity of comparing crime rates across different cities and countries, emphasizing that the narrative of American cities being universally more dangerous is not entirely accurate.
Neighborhood Crime Distribution in Toronto
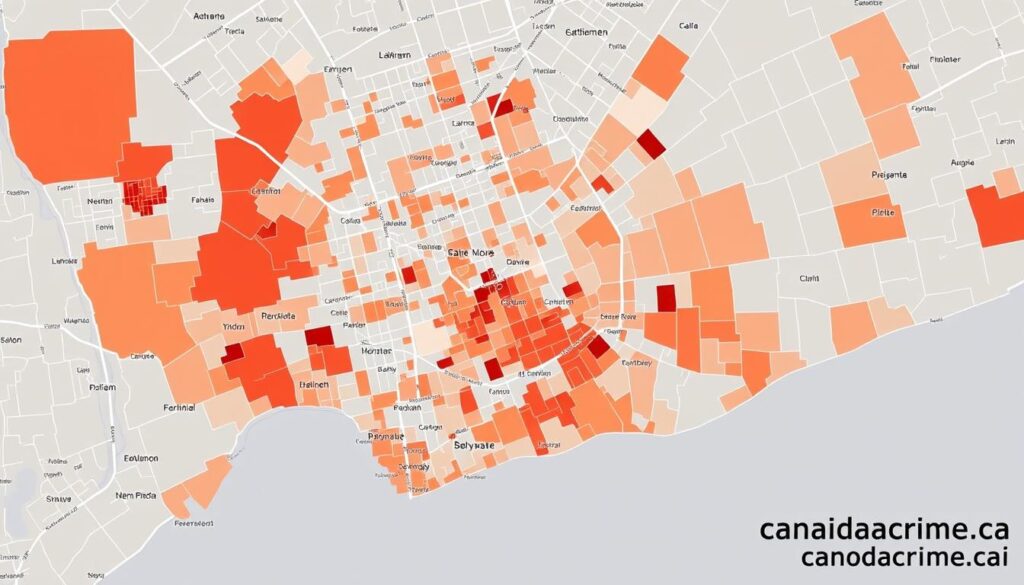
Toronto’s crime landscape varies significantly across different neighborhoods, revealing a complex picture of safety and crime distribution. The city’s overall crime rate can mask significant local differences that directly impact people’s day-to-day experiences with safety and security.
High-Crime Areas
Some Toronto neighborhoods experience higher crime rates, with West Humber Clairville reporting the highest number of major crimes year-to-date, at 1,570 incidents, representing a 30.5% increase over the previous year. Other areas with high crime rates include Downtown Yonge East with 705 incidents, Moss Park with 695 incidents, and Yonge-Bay Corridor with 590 incidents. These downtown areas face challenges common to urban core regions.
| Neighborhood | Major Crimes Year-to-Date | Percentage Change |
|---|---|---|
| West Humber Clairville | 1,570 | +30.5% |
| Downtown Yonge East | 705 | N/A |
| Moss Park | 695 | N/A |
Safest Neighborhoods
In contrast, some neighborhoods enjoy lower crime rates. Woodbine-Lumsden stands out as one of the safest areas, with only 50 reported major crimes, marking a 35% decrease from the previous year. Other neighborhoods experiencing significant increases in crime rates include Princess-Rosethorn with a 215.3% rise and Kingsway South up by 140.7%, challenging perceptions that crime is confined to lower-income areas.
Public Transit Safety Concerns
Toronto’s public transit safety concerns have escalated, highlighting the need for effective measures to protect TTC riders. The Toronto Transit Commission serves millions of passengers across diverse neighborhoods, making it a critical component of the city’s infrastructure.
Violent Crimes on TTC
The TTC experienced a troubling 46% increase in violent incidents against passengers in 2022 compared to 2021, totaling 1,068 violent incidents. This surge in violence included high-profile incidents such as people being shoved onto tracks, stabbed, or shot at with BB guns, creating significant public anxiety about transit safety.
However, recent data indicates an improvement, with offenses against TTC riders decreasing by 24% between January 2023 and January 2024. This decline suggests that the enhanced security measures implemented by the government may be having a positive impact.
Security Measures Implementation
In response to the rise in violence on the TTC, the government has increased security measures. This includes deploying 80 Toronto Police officers for 24-hour patrols throughout the system, along with 20 community safety ambassadors and 50 security guards to enhance rider protection.
| Security Measure | Description | Quantity |
|---|---|---|
| Toronto Police Officers | 24-hour patrols | 80 |
| Community Safety Ambassadors | Enhance rider protection | 20 |
| Security Guards | Additional security presence | 50 |

Organized Crime in Toronto
Organized crime has deep roots in Toronto, dating back to the early 20th century. The city’s strategic location and economic significance have made it an attractive hub for various criminal organizations over the years.
Historical Development
During the Prohibition era, Toronto became a major center for bootlegging operations into the United States. Figures like Rocco Perri and Bessie Starkman emerged as prominent gangsters involved in alcohol smuggling and heroin trafficking. Italian organized crime groups, particularly the Calabrian ‘Ndrangheta and Sicilian Mafia, have maintained a significant presence in the city.
The 1950s and 1960s saw the emergence of outlaw motorcycle gangs in the Toronto area, including the Vagabonds, Para-Dice Riders, and Golden Hawk Riders. By 1965, Satan’s Choice Motorcycle Club formed and quickly became a dominant force, illustrating the evolving landscape of organized crime in the city.
Current Organized Crime Landscape
Today’s organized crime landscape in Toronto is diverse and sophisticated. Traditional mafia-type organizations operate alongside international drug trafficking networks, human trafficking operations, and cybercrime groups targeting people across multiple jurisdictions.
| Type of Organized Crime | Description |
|---|---|
| Italian Organized Crime | Groups like the Calabrian ‘Ndrangheta and Sicilian Mafia continue to have a significant presence. |
| Outlaw Motorcycle Gangs | Emergence of gangs like Satan’s Choice and others in the mid-20th century. |
| International Crime Networks | Involvement in drug trafficking, human trafficking, and cybercrime. |

Understanding the Canadian Criminal Code
The Criminal Code of Canada plays a pivotal role in shaping the legal landscape of Toronto, influencing crime prevention and enforcement strategies. It serves as the foundation for criminal law enforcement, establishing definitions for offenses, procedures for prosecution, and guidelines for sentencing.
Key Provisions Relevant to Toronto Crime
The Canadian Criminal Code contains several key provisions that are particularly relevant to Toronto’s crime landscape. These include sections addressing firearms offenses, gang-related activities, drug trafficking, and violent crimes. For instance, the Code outlines specific laws and penalties for crimes such as homicide, assault, and robbery, which are critical in understanding Toronto’s crime rate. Recent studies have examined the effectiveness of these provisions in deterring specific types of crime, influencing policy decisions and enforcement strategies.
- Firearms offenses are a significant concern, with laws regulating the possession, sale, and use of firearms.
- Gang-related activities are addressed through provisions targeting organized crime.
- Drug trafficking laws aim to curb the distribution and sale of illicit substances.
Recent Legislative Changes
The Canadian government periodically amends the Criminal Code to address emerging crime trends. Recent changes have focused on combating gun violence, organized crime, and cybercrime. These amendments reflect the government’s efforts to adapt to evolving crime patterns and enhance public safety. Understanding these changes is crucial for contextualizing crime rate statistics, as they can impact how offenses are categorized, reported, and prosecuted.
Crime Prevention Strategies in Toronto
Toronto’s crime prevention strategies are multifaceted, involving both community-based initiatives and law enforcement approaches to address the root causes of crime. The city’s approach is designed to reduce crime rates and improve overall safety for its residents.
Community-Based Initiatives
Community-based prevention strategies play a crucial role in Toronto’s crime prevention efforts. Neighborhood watch programs, youth mentorship initiatives, and targeted interventions in areas with historically high crime rates are some of the key initiatives. These programs aim to address the underlying factors that contribute to criminal behavior, such as poverty, lack of education, and unemployment. For instance, a study found that community-based initiatives can be effective in reducing crime rates by engaging people in the community and providing them with support and resources.
Programs targeting at-risk youth have shown promising results, with mentorship and skills development initiatives helping to divert young people away from criminal activities. By engaging with the community and providing opportunities for people to get involved, Toronto is able to build trust and foster a sense of ownership among its residents.
Law Enforcement Approaches
The Toronto Police Service has implemented data-driven policing methods that use statistical analysis to identify crime hotspots and deploy resources more effectively. This approach has resulted in measurable improvements in certain high-risk areas. By analyzing crime patterns and trends, law enforcement agencies can develop targeted strategies to address specific types of crime, such as property crime. For example, improved lighting, security camera networks, and environmental design modifications have successfully reduced theft and vandalism in commercial districts.
Collaborative approaches involving cooperation between police, social services, mental health professionals, and community organizations have proven most effective at addressing complex crime issues that affect vulnerable people in the city. By working together, these agencies can provide a more comprehensive response to crime and help to reduce the overall crime rate in Toronto.
Conclusion: The Future of Crime Rates in Toronto
Understanding crime trends in Toronto is crucial for developing effective prevention strategies. As the city continues to grow and evolve, its crime landscape remains a complex issue influenced by various factors, including population growth, economic conditions, and housing affordability.
Toronto’s crime rates have shown mixed signals in recent years, with decreases in certain property crimes contrasted with rises in violent offenses, particularly those involving weapons. Comparative analysis with other Canadian cities and major American urban centers like New York reveals that Toronto maintains a favorable position in terms of violent crime per 100,000 people.
The future crime trends in Toronto will likely be shaped by multiple factors, including the effectiveness of both prevention programs and law enforcement strategies in high-risk areas. As Toronto continues to grow, maintaining its relatively low rates of violent crime while addressing property crime and emerging threats will require ongoing adaptation of prevention strategies and criminal justice approaches.
Addressing socioeconomic factors that contribute to crime, such as poverty and inequality, will be crucial in maintaining Toronto’s position as one of the safer large urban centers in North America. By understanding these dynamics and continuing to adapt crime prevention strategies, Toronto can work towards a safer future for its residents.

