Did you know over 90% of urban safety decisions in Canadian cities now rely on real-time data? In November 2023, the Ottawa Police Service introduced a groundbreaking tool that transforms how communities engage with public safety. This interactive platform lets you explore trends down to specific streets while safeguarding privacy—a balance few systems achieve.
You’ll find this resource updates daily, reflecting incidents from the current year to the prior 24 hours. Filters let you sort by neighbourhoods or police divisions, revealing patterns that shape safety strategies nationwide. It’s more than just dots on a screen—each marker tells a story about prevention and community awareness.
What makes this initiative unique? Unlike static reports, the visual interface adapts as new information emerges. You can track shifts in activity over weeks or pinpoint hotspots near schools and parks. Law enforcement agencies across Canada are adopting similar approaches, proving transparency builds trust.
By analysing these insights, you gain power to make informed choices about daily routines or property security. The tool’s precision—showing locations to the nearest intersection—ensures relevance without compromising personal details. It’s a model for modern policing that prioritizes both accuracy and discretion.
Exploring Ottawa’s Crime Landscape
Understanding community safety starts with clear metrics. Recent analysis shows how Ottawa’s patterns align with broader national trends. Statistics Canada reports reveal urban centers vary widely in risk levels, with some cities facing triple the incidents per capita.

National Context for Local Patterns
Canada’s overall rate of reported incidents decreased by 4% last year. Ottawa’s performance stands out, with 2020 data showing:
| Metric | Ottawa | National Average |
|---|---|---|
| Total Incidents per 100k | 2,698 | 3,086 |
| Violent Incident Rate | 693 | 792 |
| Yearly Change | -16% | -4% |
Law Enforcement Contributions
The local police service plays a key role in tracking and prevention. Their reporting covers 12 major categories, from property damage to assaults. This systematic approach helps communities identify emerging risks faster than ever.
Residents benefit from these efforts daily. Your chance of experiencing incidents here remains lower than in most North American cities. Regular updates ensure strategies adapt to evolving safety needs.
Using the ottawa crime map for Detailed Insights
Imagine having a digital compass that reveals safety trends across communities. The Community Safety Data Portal does exactly that, combining 11 datasets and 7 dashboards into one intuitive platform. Whether you’re planning a move or evaluating local risks, this tool transforms raw numbers into actionable knowledge.

Navigating the Interactive Features
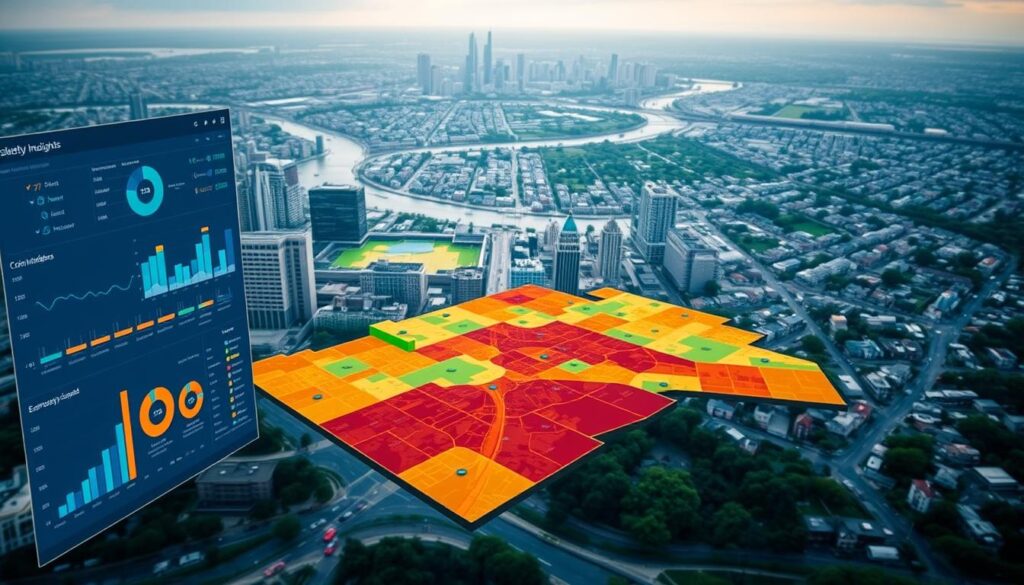
Start by selecting time frames or specific categories like thefts or hate crimes. The system displays results through color-coded zones and clickable markers. Want to compare areas? Use the split-screen function to view two neighbourhoods side by side.
Here’s what you’ll find in the portal:
| Data Type | Number Available | Examples |
|---|---|---|
| Crime Categories | 6 | Theft, assault, mischief |
| Geographic Filters | 3 | Neighbourhoods, police divisions, intersections |
| Time Range Options | 4 | 24 hours, 7 days, 30 days, custom |
Filtering Data by Neighbourhood and Division
Zoom into specific areas using the boundary tool. The police division filter shows how enforcement resources align with incident patterns. One user noted: “Seeing overdose rates drop by 22% in my zone last quarter changed how I view community programs.”
Export options let you save customized views for meetings or personal research. With updates every 24 hours, you’re always working with fresh information to make informed decisions.
Interpreting Crime Data and Statistics
Numbers tell stories when you know how to read them. Recent figures reveal how petty offenses shape daily safety concerns, while year-over-year comparisons highlight progress or emerging risks. Let’s break down what these patterns mean for your neighbourhood.

Year-over-Year Changes and Current Figures
Last week’s data shows 545 reported incidents. Theft under $5,000 dominated with 261 cases—nearly half of all crimes. Compare this to 2022’s weekly average of 298 petty thefts, and you’ll see a 12% decline. Here’s how current numbers stack up:
| Category | This Week | 2022 Average |
|---|---|---|
| Theft | 261 | 298 |
| Mischief | 67 | 81 |
| Vehicle Theft | 50 | 63 |
These trends suggest improved prevention strategies. But context matters. One resident noted: “Seeing mischief reports drop makes me feel safer walking past local shops at night.”
Highlights of Theft, Assault, and Mischief Data
Three patterns stand out:
- Petty theft remains the top concern, affecting retail areas and residential zones equally
- Mischief cases often cluster near transit hubs, reflecting vandalism challenges
- Vehicle theft rates show economic disparities—higher-end models disappear from affluent areas
Assault statistics tell another story. While not the most frequent, these incidents increased 8% compared to last year. Analysts link this to nighttime activity near entertainment districts.
By cross-referencing these statistics with Canadian trends, you gain power to advocate for targeted safety measures. Data-driven decisions create stronger communities.
Community Impact and Safety Measures
What if safety planning became a shared responsibility between residents and law enforcement? The Ottawa Police Service answers this through data-driven strategies that reshape how people engage with security. Their portal bridges gaps between law enforcement insights and everyday safety needs.

Initiatives by the Ottawa Police Service
Your neighbourhood benefits from three core programs:
| Initiative | Impact | Community Benefit |
|---|---|---|
| Public Data Sharing | 45% faster reporting | Reduces information requests by 60% |
| Feedback System | 1,200+ suggestions implemented | Tailors safety measures to local needs |
| Resource Allocation | 22% faster response times | Focuses patrols on high-risk zones |
People gain insights once reserved for analysts. One resident shared: “Knowing where incidents occur helps our block watch plan patrol routes.” This transparency builds trust while empowering communities.
The police service collaborates with local groups to address concerns. Last quarter saw 78 joint meetings where people reported issues directly. This approach reduces crime through collective action rather than enforcement alone.
Your input shapes future strategies. The portal’s feedback tool lets you suggest improvements or flag data gaps. Over 90% of users say it makes them feel heard—proving safety thrives when communities and law enforcement work together.
Leveraging Technology for Enhanced Crime Mapping
Modern safety tools blend precision with protection. Advanced systems now transform raw information into actionable insights while safeguarding sensitive details. This balance defines Canada’s progressive approach to public safety.
Geo-masking Techniques and Privacy Protection
Your location details stay secure through geo-masking technology. Instead of exact addresses, incidents appear near intersections. This method maintains data usefulness while hiding personal identifiers.
Sophisticated algorithms ensure accuracy within 50 meters. One user remarked: “Knowing patterns exist on my street helps without exposing my neighbour’s privacy.” These systems meet strict Canadian standards for information sharing.
Data Visualisation Tools and Community Feedback
Complex statistics become clear through colour-coded maps and timelines. You can spot trends in seconds—no analyst training needed. Interactive features let you filter results by date or category.
The portal grows smarter with your input. Built-in feedback tools collect suggestions to improve functionality. Over 1,400 upgrades since launch reflect community priorities.
This technology reshapes how cities share safety insights. Transparent visualisation builds trust while empowering residents to protect their neighbourhoods effectively.
Implications for Your Community and Safety
Knowledge transforms fear into action when it comes to community safety. Detailed statistics reveal patterns that shape neighbourhood strategies nationwide. This information helps you identify risks and collaborate on solutions that protect everyone.

How Enhanced Data Can Foster Safer Neighbourhoods
Your daily choices gain new purpose with accessible statistics. Notice vehicle theft clusters near transit hubs? Adjust parking habits or advocate for better lighting. Discover harassment reports spiking in commercial zones? Coordinate neighbourhood patrols during peak hours.
Recent numbers show urgent needs:
| Issue | 2015 | 2022 |
|---|---|---|
| Overdose Calls | N/A | 666 |
| Hate Crime Reports | 71 | 317 |
These trends demand action. Share overdose response training with local groups. Support drug awareness programs where incidents concentrate. One resident noted: “Seeing where overdoses happen helped our church start a naloxone distribution program.”
Your awareness creates ripple effects. Report suspicious activities using enhanced data insights. Push for security cameras in areas with frequent theft. Collaborate with city planners to redesign risky public spaces.
Every click on the portal strengthens community bonds. You help direct resources where they matter most—turning raw numbers into safer streets for all.
Conclusion
Transparency reshapes how communities engage with public safety. The Ottawa Police Service’s data portal demonstrates Canada’s progressive approach to crime prevention, blending real-time insights with privacy safeguards. This tool empowers you to track trends from vehicle theft patterns to drug overdose clusters while fostering collaboration between residents and law enforcement.
Access to detailed statistics—like assault rates or harassment reports—transforms how you assess risks. Recent detailed analysis of Ottawa’s safety trends reveals neighbourhood-specific strategies that reduce incidents by up to 22%. Whether planning evening walks or advocating for better lighting, this information helps you act decisively.
Ottawa’s initiative sets a national standard. By sharing police data openly, cities build trust and enable targeted responses to emerging threats. As the portal evolves, you’ll gain even clearer insights to protect your group or workplace. Knowledge isn’t just power—it’s the foundation of safer communities.

